Several interrelated markets are simultaneously at important crossroads, so we want to be aware and prepared for the possibilities that may soon materialize. The (northern hemisphere) summer months tend to be the slowest time of the year not just for precious metals, but for many of the capital markets.
There is an old saying: “Sell in May and go away.” Certain years this is more useful advice than others, but the point is that we are nearing the end of what has essentially been range-bound action across the precious metals, stock markets, and currency markets since late spring, even with the dramatic events associated with Brexit in June. One way or another, it appears likely that market action is going to start getting more “interesting” after the end of the summer season, which culminates unofficially on the Labor Day holiday in the US next Monday, September 5.
US Stock Market
The US stock market continues to meander higher, defying most recent analysts’ attempts to pinpoint a top. We remain a somewhat detached observer of the action in broad US stocks, as we hold no investments in them directly. However, all markets are somewhat interrelated, and as precious metals and stocks can sometimes be counter-cyclical, we are, by owning precious metals, by default “short” such other markets.
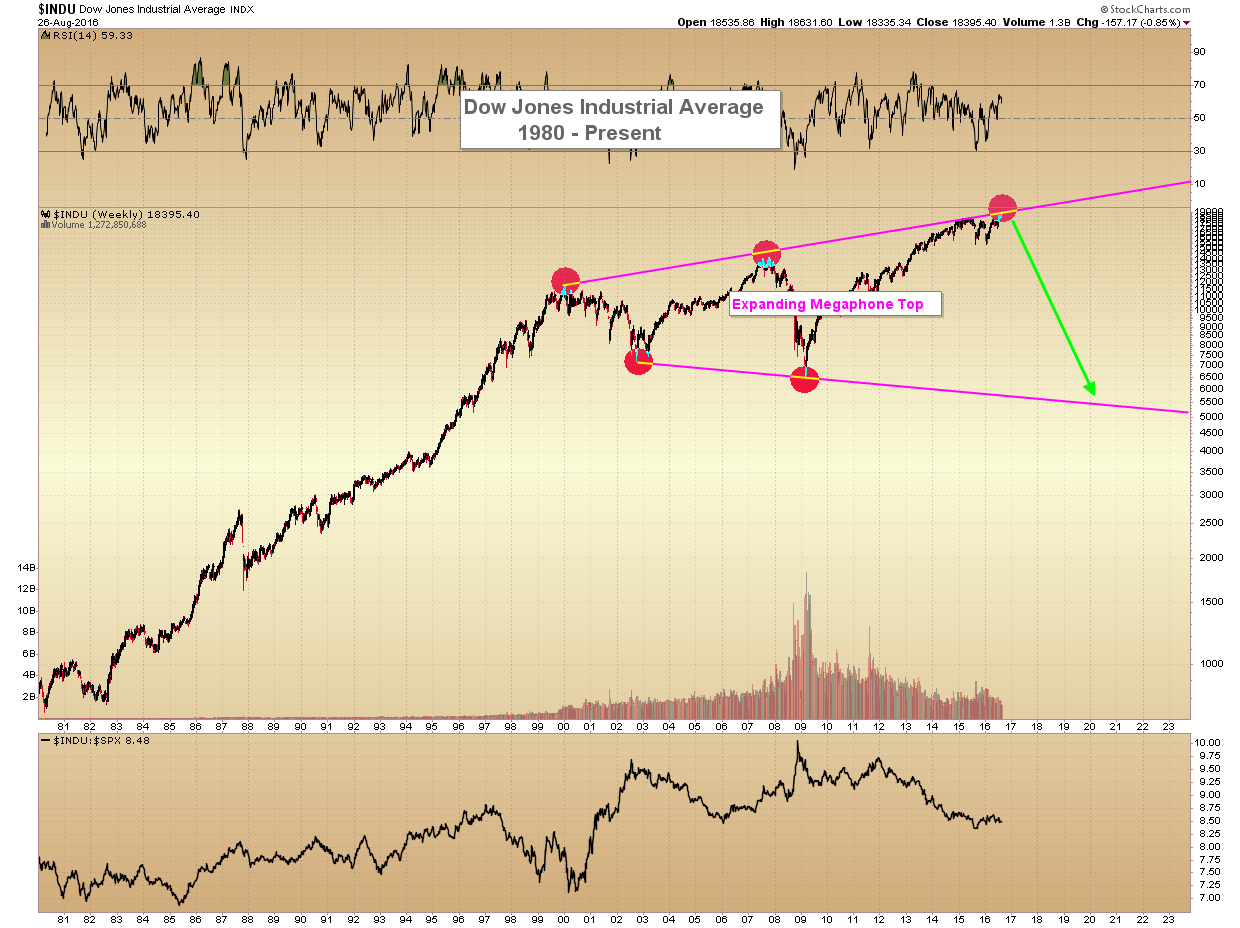
Taking the long-term view of the US Dow Jones Industrial Average, the most likely scenario we see is that the market is forming a generational-timeframe “expanding megaphone” top. The expanding megaphone is a topping pattern with several successive highs and successive lows, each high being above the previous high, and each low being below the previous low. It takes the shape of an expanding outward cone or megaphone. The pattern shows a bifurcated market experiencing extreme swings in psychology every several years, a scenario which usually does not end with a positive resolution.
(See image A)
We have had three hits along the upper trend line of this pattern since the year 2000, and two hits on the lower trend. Consequently, the pattern calls for a drop in the Dow down to the lower trend line at minimum, for a third hit, at some point over the next 3-5 years. Based on the projection, this would equate roughly Dow 5,000.
Long-term patterns such as this are certainly not appropriate for immediate trading, and indeed as we have seen potential tops can take much longer to materialize than most anticipate. It is quite possible for the stock market to continue grinding higher for another year or two as part of this formation.
However, the level of complacency seen in the market now is certainly at levels ripe for a top to form. Most employees are blissfully happy to continue contributing to stock 401(k) retirement funds, secure in the knowledge of slow and steady annual gains.
History shows that such psychological complacency is typically a precursor to significant market corrections.
US Bond Market
In generations past, bonds and stocks were considered opposite ends of the investment spectrum. Stocks were seen as vehicles for growth and appreciation, and bonds were seen as investments for safety. As such, during times when stocks fell, funds often moved into bonds. And during times when stocks were appreciating, money conversely moved out of bonds.
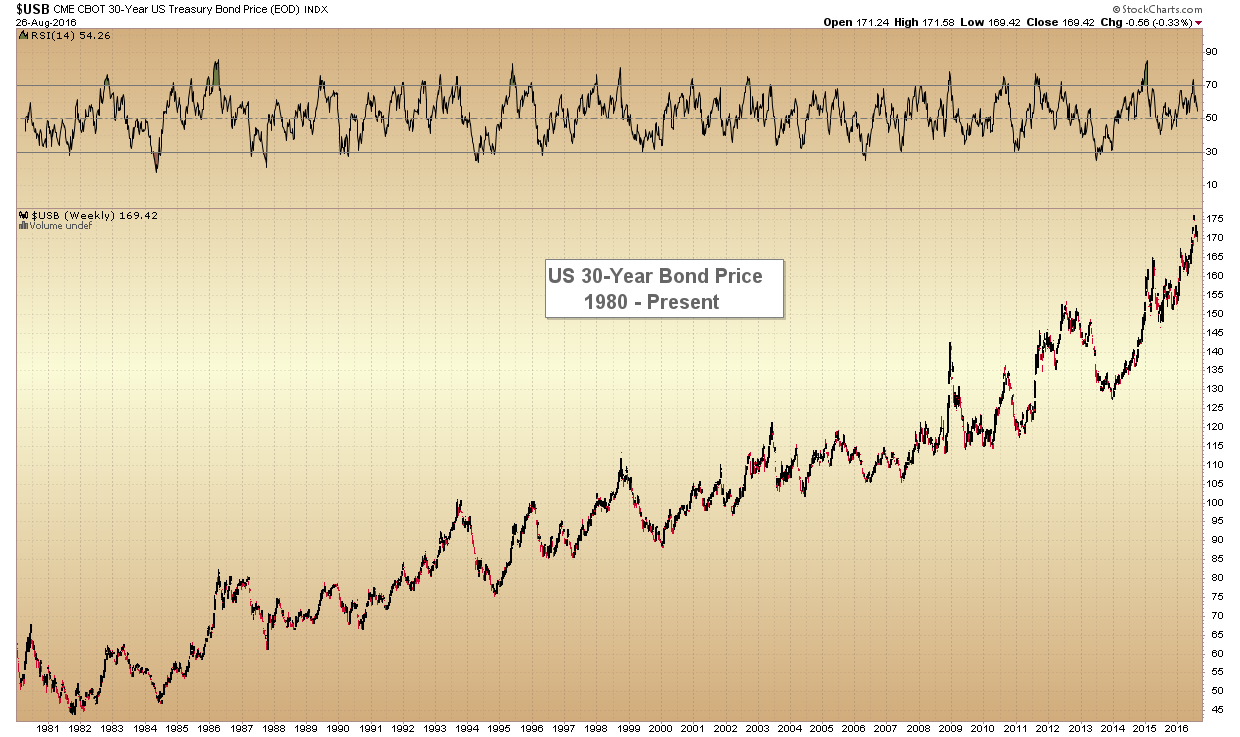
With the advent of unprecedented money-printing by the Fed after the 2008 financial crisis, all of that changed. For the first time in the modern era, since 2008 we have seen both stock and bonds rising in near unison. Keep in mind the above graph of the Dow – which is at an all-time high -- when we look at the following graph of US 30-year bond prices over the same time period:
(See image B)
As we can see, US 30-year bond prices are also at all-time highs, which is what has forced their yields to all-time lows.
This is the first occasion in modern US history when both stock and bond prices are simultaneously at all-time highs. When we say we are living through an unprecedented time, we mean it literally.
How is it possible that so much money is flowing both into stocks (growth assets) and bonds (safety assets) at the same time?
The answer is simple. The Fed has printed so much money over the last eight years, that it is searching for a home somewhere… anywhere. Fundamentals have been pushed aside, and money is flowing wherever it can in search of some type of return.
The Fed has turned on a fire hose in an attempt to fill a bathtub. While the tub is certainly getting filled, so is the rest of the bathroom, the living room, and the downstairs apartment, for that matter.
The only question that remains is where is all this money going to flow when these trends reverse, and we see what may be for the first time in history falling stock and bond prices simultaneously?
It is estimated that the size of the global bond market is roughly $100 trillion, while the size of the global equity markets are nearly $70 trillion. Meanwhile, the dollar amount of all the gold ever mined in the history of the world is close to $8 trillion, but less than half of that is available for investment (the rest is held as jewelry and industrial fabrication).
What is setting up when even a small portion of the $170 trillion in combined bond + equity markets attempts to start exiting those assets and to find a home in precious metals will make the moves we have witnessed thus far look like a mere warmup.
Stay tuned… the bubble behavior in bonds and stocks has not culminated yet… but Stein’s Law says: “That which cannot continue forever will one day stop.” And that day is drawing closer.
Gold Analysis
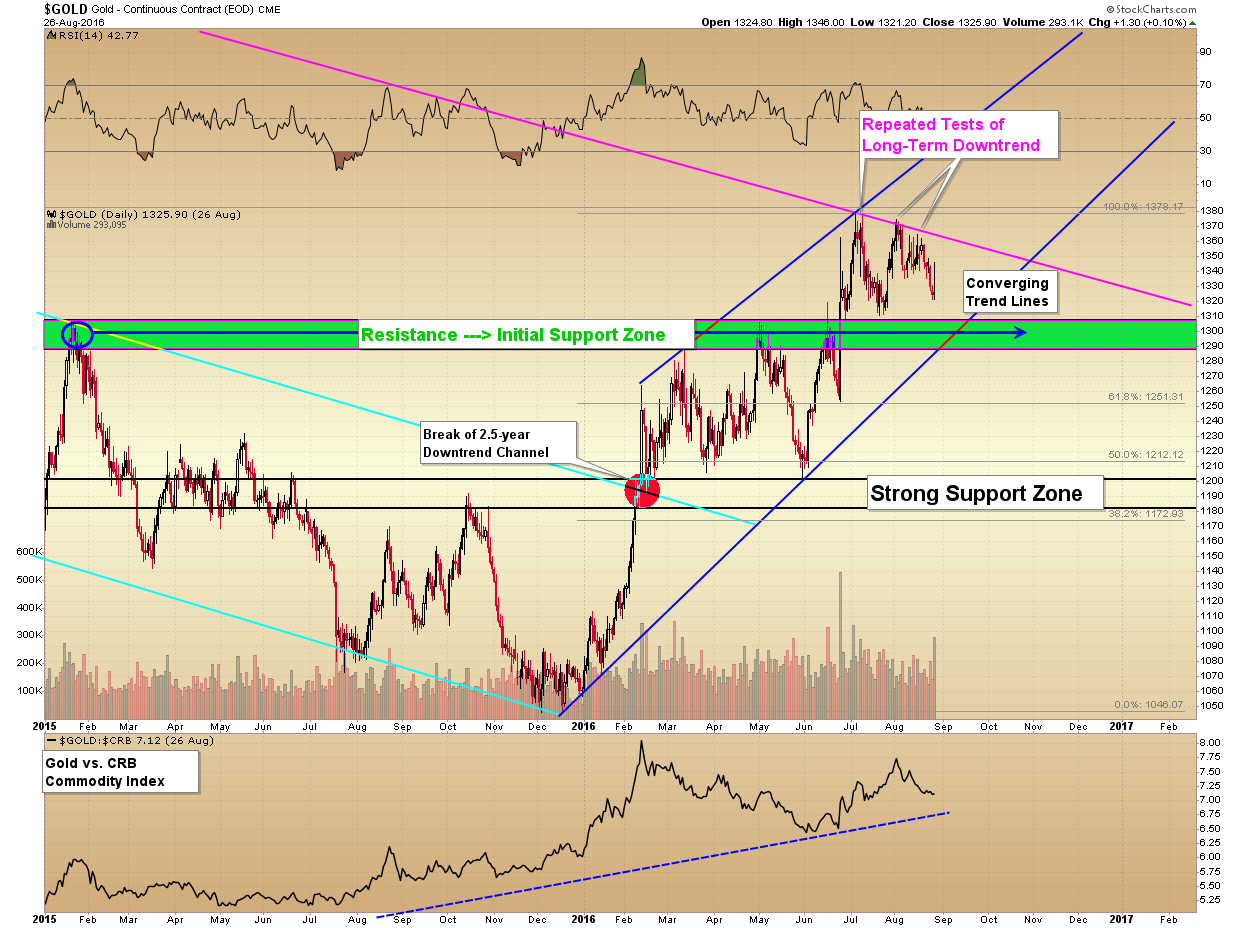
Despite the $20 or 1.5% drop seen in gold this week and the whipsawing that occurred on Friday after Yellen’s comments, the situation in the world’s monetary element remains largely unchanged from a technical standpoint.
On the near-term chart gold is still awaiting a resolution of the convergence of the multiple trend lines we have been monitoring since June. Resistance continues to appear every time gold approaches $1,355 - $1,378, while support is emerging above the $1,285 - $1,306 zone labeled in green. Gold’s primary blue rising channel remains in play until proven otherwise, and one or more of these trends will be forced to break within the next 6 weeks.
(See image C)
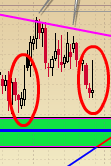
The action on Friday, although disappointing to watch throughout the day, was not altogether bad from a technical perspective. Below we are zooming the above chart in to the 1-month perspective to analyze the Japanese candlesticks -- each representing one day’s price action:
(See image D)
The pattern seen on Friday is called a gravestone doji in Japanese candlestick analysis, because it looks like a gravestone with a long upper shadow. Context is critical for evaluation of these candlesticks. When gravestone dojis occur after a strong advance, they can be a sign of a top, as the price rises above a specific price level but then falls back below it later in the day.
Yet when gravestone dojis occur near an area of support, they typically indicate budding strength to come. In this case, we can see a very similar doji that appeared three weeks prior, circled in red. Note that the day represented a local support, after which prices rose over the next week.
Gravestone dojis do not always represent exact bottoms, but they do show us that there are buyers lurking in the background. The pattern should be considered a warning to the bears that they are losing their grip on the recent decline.
If a short-term bottom indeed emerges here after this gravestone doji, we will be looking for another attempt at gold breaking its long-term (magenta) downtrend within the next 1-2 weeks.
Christopher Aaron,
Bullion Exchanges Market Analyst
Christopher Aaron has been trading in the commodity and financial markets since the early 2000’s. He began his career as an intelligence analyst for the Central Intelligence Agency, where he specialized in the creation and interpretation of pattern-of- life mapping in Afghanistan and Iraq.
Technical analysis shares many similarities with mapping: both are based on the observations of repeating andimbedded patterns in human nature.
His strategy of blending behavioral and technical analysis has helped him and his clients to identify both long-term market cycles and short-term opportunities for profit.
This article is provided as a third party analysis and does not necessarily matches views of Bullion Exchanges and should not be considered as financial advice in any way.
Share: