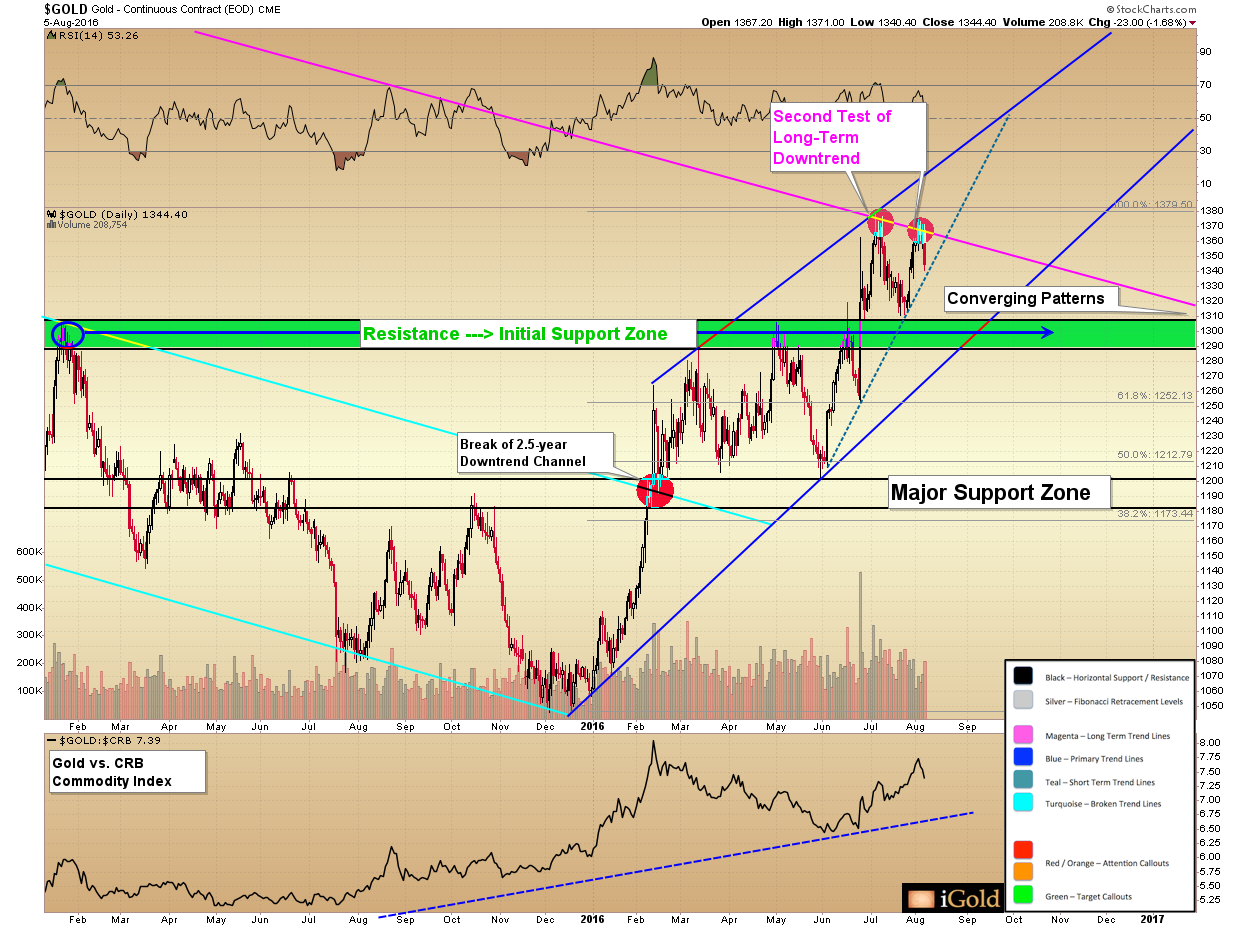
Gold has just made its second attempt within the last five weeks at breaking through its long-term downtrend (see long-term charts on the previous article, available here), and this opportunity once again proved unsuccessful. This price action increases the validity of the resistance shown by the trend line and its importance as a technical data point. Gold is going to have to prove it can overcome this level for the next leg of the bull market to commence.
Yet despite this short-term weakness, we have several reasons to believe that a breakout will be arriving shortly, and those reasons are presented herein.
Gold rose as high as $1,367 early in the week, but sellers continue to appear just above this level and the price backed off to close at $1,335 on the spot market by Friday afternoon.
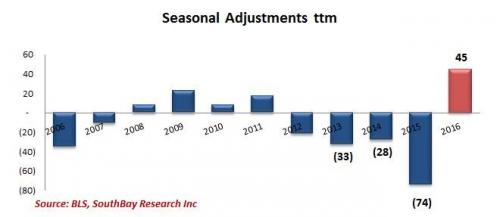
As is typical, charts can often tell us “what” is setting up in the gold market, but the “why” component usually remains to be seen. So what was the cause of gold’s fall on Friday? In this case, the drop was due to the Bureau of Labor Statistics (BLS) which released a “seasonally-adjusted” jobs report for July showing 255,000 jobs created for the month in the United States.
The term “seasonally-adjusted” means the number was not actually derived from a survey of employers proper, but rather estimated based on a seasonal algorithm that the BLS uses for assumed job creation, resulting from historic seasonal trends.
Interestingly, 2016 has seen the highest assumed seasonal job growth reported by the BLS in the last 10 years, as can be seen below:
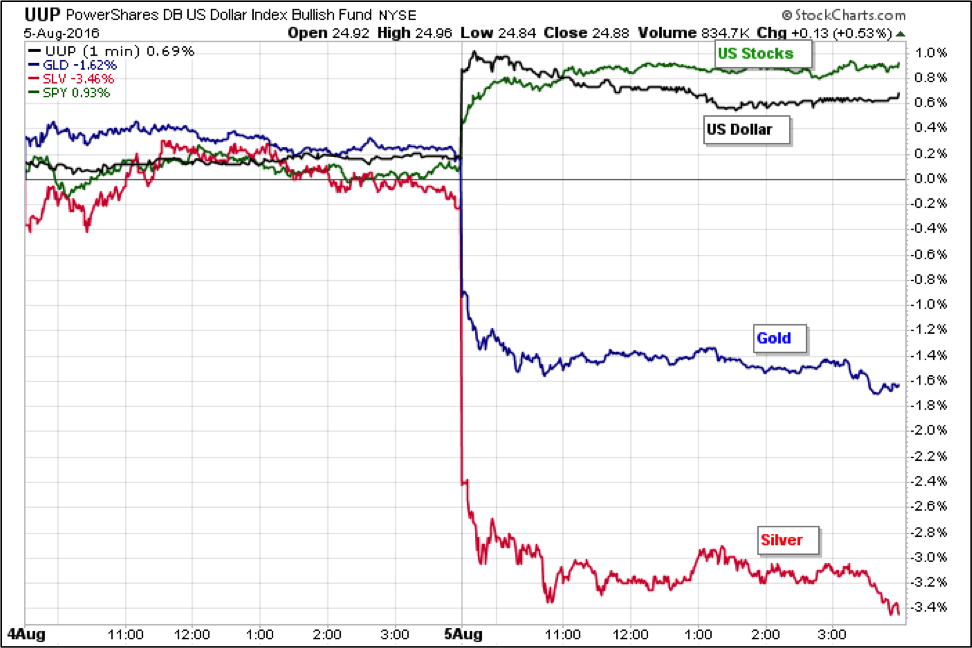
Exactly how they derive this assumed data is a question on many analysts’ minds, but regardless of the validity of the figure, the market interpreted the announcement to be largely positive for the US dollar and the US stock market, which both spiked higher. As a result, both gold and silver were sold off.
We now return to the charts to guide us as to what may happen next for gold and the precious metals.
Gold is “Coiling Up”
Refer again to the first primary chart of gold at the beginning of this article. Gold is now “coiling up” between strong resistance below the previously-mentioned downtrend, and the strong support which is appearing between $1,285 and $1,306, as shown by the green band. This is labeled “Converging Patterns” on the chart.
Of course, this support zone was the former resistance zone we had been following for nearly 18 months, which, decisively broken in June, is now seeing second-chance buyers step in each time the price retreats to this zone.
When markets coil up in this manner, like a spring being held down — eventually when released the market will experience a significant move in one direction or another.
In studying the area on the primary gold chart above representing the convergence of the downtrend resistance and the green support zone, we note that the meeting of these two trends does not necessarily have to happen until after January 2017. Technically speaking then, the market could take through the winter to break higher or lower from the convergence of these patterns.
However, in years of studying these charts, we can say that in the majority of cases the convergence will resolve itself in one direction or another before the actual meeting of the trends.
Further, based on 45 years of available data since gold has traded free from the US dollar standard, the single strongest month of the year for gold is straight ahead: September.
We thus have a high expectation that the breaking of these converging trend patterns is going to take place within the next 4-8 weeks.
Gold Miners Still Providing Leadership Clues
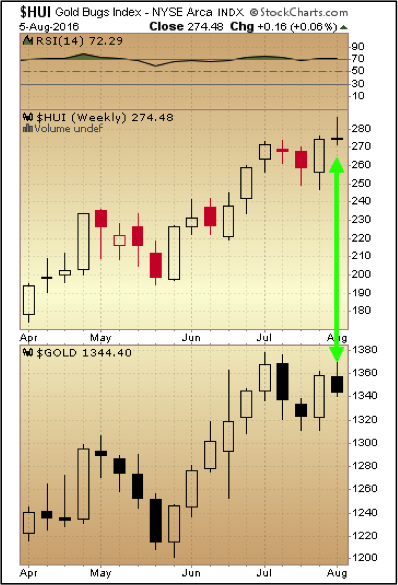
The gold miners are still anticipating this breakout in the metal, as shown below by the quick reference between the HUI gold miners index on top and spot gold below.
Note that the large cap miners closed the week with a marginal gain, whereas the metal finished lower by Friday. The miners indeed finished at a new 52-week closing weekly high.
This outperformance, subtle though it may seem, is continuing to give us clues regarding the resolution of the metal’s converging trend patterns.
Takeaway on Gold Prices
Strong support exists between $1,285 and $1,306, while resistance is being seen above $1,365. These price levels are converging on the yearly charts, and when opposing trends converge one or the other must break. At present the seasonal strong period for precious metals is due ahead, and we observe leadership in the gold mining equities. We see a high probability of a gold price breakout within the next 4-8 weeks, with an advance to target $1,450.
Christopher Aaron,
Bullion Exchanges Market Analyst
Share: