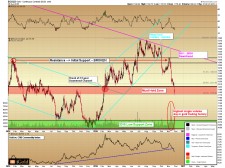
Let us be very clear: we are bullish on precious metals over the long term. Yet over the intermediate timeframe, the market is giving us signals that the long-term bottoms we are expecting to form may take a more complex path than was originally anticipated. We should stay nimble and be prepared for some twists and turns going forward.
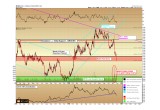
For the last week, gold spot price fell by $30 to close at $1,183 as of the NY COMEX final print, a 2.4% loss for the week. Notably, the low for the week came late Thursday night EST / early Friday morning in Asia, at near $1,171, before bouncing, touching the 61.8% Fibonacci retracement line of the entire December through July advance, and the final “Must Hold” support zone that we have been monitoring for some months.
(See image A)
If gold is going to put in a low in this region, it must immediately rise this week above the $1,200 level and maintain a weekly close there. This would turn the break below the $1,200 level into a “false breakdown”, and would require us to re-examine the possibility that the next advance is indeed underway. Such fake-outs do occur in all markets periodically, and the only way to identify them is to maintain a close watch of the key support/resistance levels. This is the only scenario in which we could consider the initial advance from 2015 to still be continuing.
However, the bulk of the evidence now in front of us leads to the conclusion that gold will need to at least retest the region of its 2015 lows, if not break below them, as part of a more complex multi-year bottoming formation.
The support below $1,173 is negligible for gold, down to the 2015 lows. Strong support levels are primarily defined by prior periods of consolidative action, and in the case of gold that consolidation took place between $1,200 and $1,305 from February to June. The fact that gold saw little to no buying interest at $1,200 last week indicates those buyers who bought the dips toward $1,200 last spring are no longer participating in the market.
Why are they no longer present? We cannot know. Those buyers were a diverse group of institutions, individuals, and funds from around the world, so we cannot possibly identify a single cause for their sum lack of participation. All we can know is what they (the market) are doing, and align ourselves for the highest probability of success.
Below $1,173, we will next look for a bottom in gold indicated by the new green shading on the chart above, which corresponds to the consolidation seen from November 2015 through early January 2016. This zone of $1,045 – $1,085 is where we would look for the possibility of gold to form a double bottom. The term double bottom is derived precisely because the price reached this level once before, and then comes back to retest (if successful) this level for a second time.
Technical Clues for the Next Bottom
No matter what the exact low price that forms for gold, we will be looking for a specific set of bottoming patterns to come into play. One of the most important bottom indicators will be to watch for a period of outperformance of the mining sector versus the metal itself. As an example, if gold were to fall to $1,045 again, we should expect to see the mining complex bottom several points above its related 2015 lows, as measured either by either the HUI or GDX index.
We will also be looking for a downtrend break in gold, as well as any other number of confirming bottoming patterns: bottoming wedge, inverse head and shoulders, gold outperformance versus CRB commodity index, etc.
These are the bottoming indicators that worked in 2008 as well as 2015, and at least several of them will allow us to target the next bottom as it approaches. Of course, we will not catch the exact bottom to the day — but the truth is no one will. We will, however, be able to observe the shift in the market for what should be a move equal to, if not greater than, the 2016 initial advance.
1999 – 2001 Gold Example
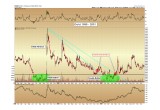
As an example, here is how the last long-term bottom in gold formed, from 1999 – 2001. The pattern featured a support zone between $250 and $265, with an initial advance to $337, a 34% surge that gave back almost all of its gains into the double bottom of 2001. Downtrend breaks were noted in successive fashion in November 2000 and then again in May 2001.
(See image B)
For long-term investors, any purchases within the 1999 – 2001 period, even at the $337 peak, were eventually seen to be excellent value once the price of gold exceeded the initial advance in 2002. It then never looked back.
Of course, no two periods in history will match exactly, but the point is that a set of potential patterns exist which tend to define most bottoms, and we fully expect to identify the next one to come.
Gold: Looking Forward
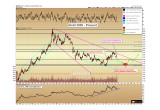
As a working hypothesis, with the expectation of a double bottom to form in gold, we propose the following trajectory for gold over the subsequent two years:
(See image C)
The primary 2013 – 2015 downtrend channel for gold, which was broken in February and shown in light blue, would be set up to act as a second support level for gold near the $1,045 double bottom.
A successful double bottom would then set up gold to challenge its long-term (magenta color) downtrend again in late 2017, with the expectation of a successful breakout either then or in early 2018. By this time, the downtrend would come in much lower, near $1,200. Yet its significance would be no less.
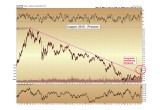
For comparison, we continue to monitor the incredible action taking place in the copper market over the last month. In just four weeks, copper has surged 28% to $2.67 per pound.
(See image D)
A similar 28% percentage gain, should gold break its long-term downtrend next year at $1,200, would result in a surge to $1,536 within four weeks. Such is the type of move we want to be positioned for ahead of time.
Christopher Aaron,
Bullion Exchanges Market Analyst
Christopher Aaron has been trading in the commodity and financial markets since the early 2000's. He began his career as an intelligence analyst for the Central Intelligence Agency, where he specialized in the creation and interpretation of pattern-of- life mapping in Afghanistan and Iraq.
Technical analysis shares many similarities with mapping: both are based on the observations of repeating and imbedded patterns in human nature.
His strategy of blending behavioral and technical analysis has helped him and his clients to identify both long-term market cycles and short-term opportunities for profit.
This article is provided as a third party analysis and does not necessarily matches views of Bullion Exchanges and should not be considered as financial advice in any way.
Share:

