To a large extent then, silver prices are going to be pushed or pulled in the general direction of the broader industrial commodities at this juncture.
Silver investors should keep one eye on the broader commodity complex at all times - and now more than ever.
Why?
According to the latest demand statistics out of Thompson Reuters, only 20% of physical silver demand in 2016 went for investment purposes in silver coins or silver bars. As a silver investor, you are still in the minority as far as usage of this precious metal goes.
The other 80% of silver demand? It went toward industrial fabrication and jewelry.
To a large extent then, silver prices are going to be pushed or pulled in the general direction of the broader industrial commodities at this juncture. There will come a time in which new demand for precious metals caused by a falling US dollar or stock market causes a more significant portion of silver to be claimed by investors, but that time is in the future. It would behoove us therefore as investors to pay close attention to the wider commodity complex.
The CRB Commodity Index
When we talk about commodities, the broadest measure that we have available is the CRB Commodity Index, which is an average of 19 commodities from around the demand spectrum. This index includes both silver and gold, along with aluminum, cocoa, coffee, copper, corn, cotton, crude oil, heating oil, lean hogs, live cattle, natural gas, nickel, orange juice, soybeans, sugar, unleaded gas, and wheat. It is not a perfect index, but it is the most diverse measure of commodity prices that we can track going back multiple decades.
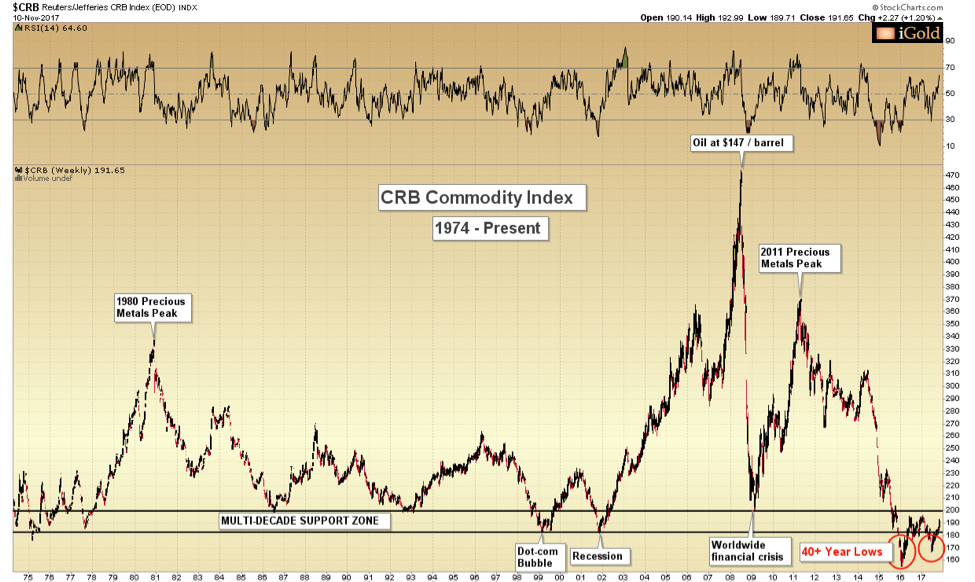
From a price analysis standpoint, the most critical aspect is that broad commodities as represented by the CRB Index are presently just above 40+ year low levels. A picture is worth a thousand words, so below we present the CRB Index from 1974 through present:
Image A
Recall that commodities, being real assets, cannot go to zero. Commodities have never have been worth zero – they never will. Yet this is the lowest price level for the commodity complex that we have seen in over 40 years.
Certainly, from a risk to reward standpoint, the proposition of an asset class at its lowest valuation in over a generation – and which cannot go to zero – whets our appetite. (In contrast, individual stocks, bonds, or currencies can indeed become worthless.)
Note the previous times when commodities bottomed near the 180 – 200 support zone on the index. The dot-com bubble, the recession of 2001-2002, and the worldwide financial crisis all marked similar lows for the complex.
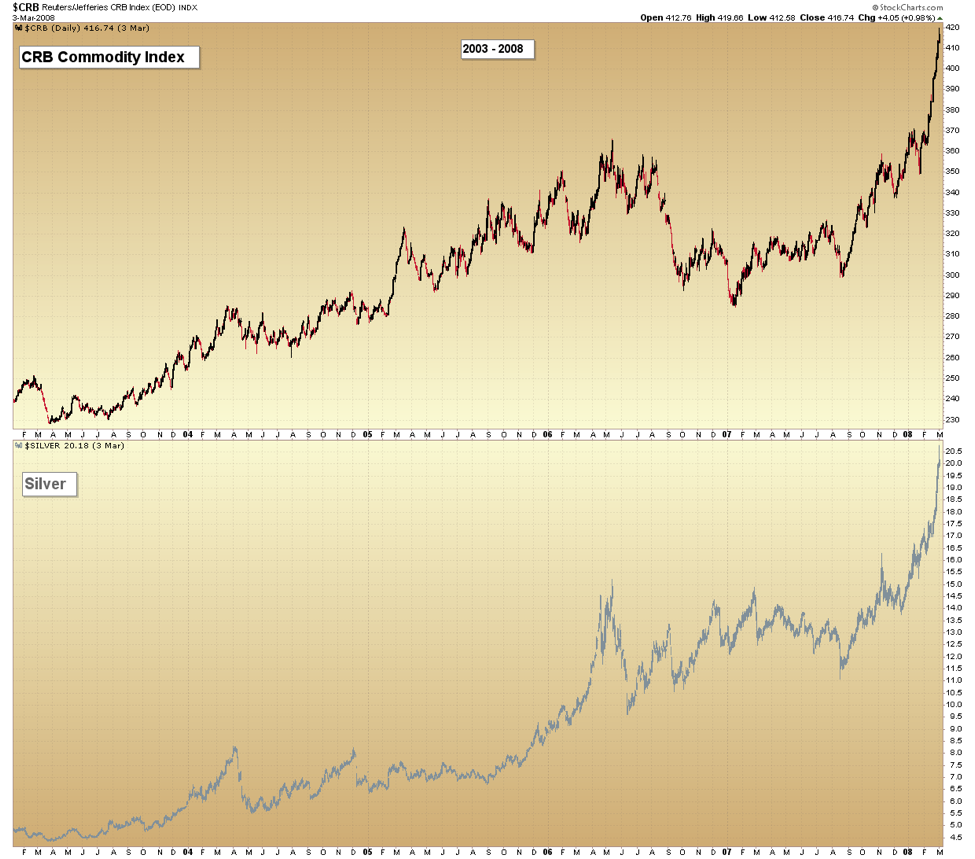
The major point for us as precious metals investors is to know that with silver, a significant portion of the demand spectrum is still to this day influenced the broader commodities. Note how similar the price trajectories were between the CRB and silver from 2003 – 2008, during this major advance:
Image B
Commodities Short-Term
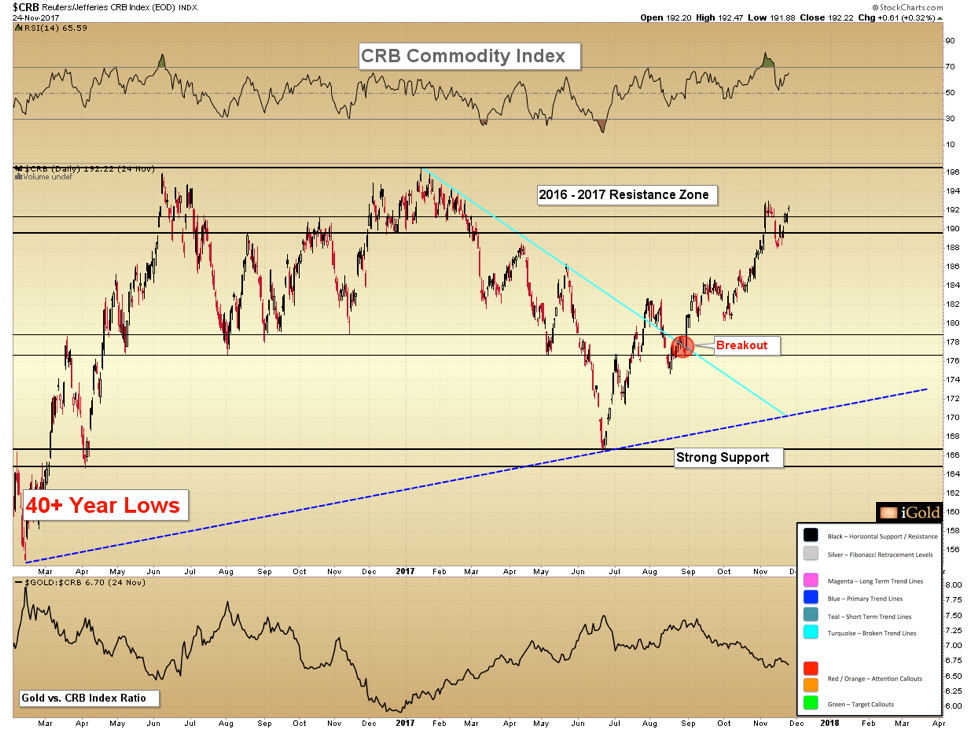
Having refreshed the long-term broad commodity perspective, let us zoom into the bottoming process that is underway. The following chart encompasses just the final two years of the first 43-year chart :
Image C
Note how having broken through its short-term declining trend in late August (turquoise color), broad commodity prices have surged over the past two weeks by over 7%. Indeed, we see here commodities now making a functional retest of their 2016 – 2017 peaks between 190 – 196 on the index.
What is next for the commodity space?
We do not expect the CRB Index will break it's 2016 - 2017 resistance zone immediately on this attempt, and indeed some consolidation toward the 176 – 179 support zone would constitute more healthy price action over the intermediate term.
However, the critical point is that the broad commodity sector is clearly putting in a low of multi-decade significance. We suspect that prices may never again fall below the 156 level seen on the CRB index in February 2016.
While each commodity will inherently move at different times for a diverse set of fundamentals, “a rising tide will lift all ships”. The theme here is that real assets are forming long-term bottoms, at a time when financial assets (US bonds, US dollar, many sectors of the stock market) are at risk of forming long-term tops.
Strong confirmation of this bottom process will come when the 196 level, matching 2016 – 2017 highs, is broken decisively. We anticipate this will occur in 2018.
Takeaway on Silver and the Commodity Complex
Silver investors should keep the long-term commodity price chart in mind at all times, as silver prices are still largely influenced by world industrial demand for diverse commodities. The CRB commodity index is bottoming at 40+ year lows, and as investment demand enters the entire sector again we expect silver to be a primary beneficiary.
Christopher Aaron,
Bullion Exchanges Market Analyst
Christopher Aaron has been trading in the commodity and financial markets since the early 2000's. He began his career as an intelligence analyst for the Central Intelligence Agency, where he specialized in the creation and interpretation of pattern-of-life mapping in Afghanistan and Iraq.
Technical analysis shares many similarities with mapping: both are based on the observations of repeating and imbedded patterns in human nature.
His strategy of blending behavioral and technical analysis has helped him and his clients to identify both long-term market cycles and short-term opportunities for profit.
This article is provided as a third party analysis and does not necessarily matches views of Bullion Exchanges and should not be considered as financial advice in any way.
Share: