Gold was up nearly $23 last week to finish at $1,196 as of the final trade in New York on Friday. Such was the third weekly gain in a row for the historically-monetary metal.
Gold was up nearly $23 last week to finish at $1,196 as of the final trade in New York on Friday. Such was the third weekly gain in a row for the historically-monetary metal.
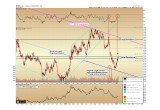
A technical update on the price of gold is in order after our analysis of December 26 came within a few days of identifying the most recent low at $1,120. Gold is at a technical juncture, the resolution of which is going to play a large role in defining the trend and level of volatility to be expected for 2017.
(See image A)
The price level between $1,190 and $1,200 is the most important that we are presently watching (black double line, labeled Initial Resistance). This price zone acted as support for gold once in February, once in March, and once again in late May. When a price level acts as support on multiple occasions, it increases the legitimacy of the buying pressure seen there. In essence, we saw the same group of value buyers step in each time the price approached $1,200 last spring.
However, something changed last November as the price retreated in the wake of the reversal, following Trump’s victory. The gold price fell through $1,200 with only so much as a two-day bounce. For whatever reason, those buyers who were present through most of 2016 at this level failed to show up in November.
Gold Approaches $1,200 Again
After bouncing at $1,120, gold is now approaching the $1,200 region again, this time from the lower side. In technical analysis, a major principle that becomes relevant is that support typically turns into resistance. What this means is that – all things being equal – we would expect that the $1,200 zone, which saw a lack of large buyers suddenly in November, should again see limited buying activity when the price is approached again.
Thus, our general expectation at this juncture is for gold to back off in the current price region, and to begin to retreat back to December 2016’s lows. A likely scenario we will be watching for is a double bottom, or perhaps a higher low to form here in 2017, when compared to 2015 and 2016’s lows of $1,045 and $1,120, respectively.
However, if gold were to surprise us and continue to advance through $1,200 immediately, it would be an important indicator for 2017. It would show us that a new set of buyers had entered the market who were not present during last November’s decline.
Such would have important ramifications for the rest of the year. First, we would set our sights on the next target at $1,251, which was the 50% Fibonacci retracement level of the entire 2016 advance, and beyond that the $1,300 region, which represents the long-term 2011-2016 downtrend that still holds.
However, even more importantly, if we see a surge above $1,200 at this juncture, it would represent the beginning of increased volatility for the gold market for the remainder of the year. In essence, we will be seeing a new group of buyers enter the market – and we do not have enough price data to gauge their buying patterns yet. They could be physical buyers who missed out on the 2016 rally, they could be central banks anticipating the need to support currencies, they could be a new class of traders. We cannot be certain on their identities, but we can be certain that they were not present in significant quantities last November -- so their presence must be considered a source of expected volatility over the remainder of 2017.
Gold Volatility Expected
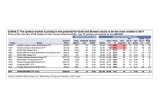
As an interesting corollary, below is a cutout from last week’s Bloomberg article, with the title shown at right. The article highlights that the options market, which allows investors to make highly-leveraged bets in either direction for an underlying asset, is pricing in the highest volatility of any sector in the world specifically for the precious metals equities in 2017. Shown by the red shaded area below, the options market is pricing in a 34% volatility premium for the large and mid-cap gold producers (GDX) and a 44% volatility premium for the junior miners (GDXJ).
(See image B)
[The implied volatility premium is the portion of the contract value that options writers build into the option price to cover their perceived volatility risk. The higher the implied volatility, the higher the premium that options writers demand to sell the contracts.
(See image C)
While most readers will be primarily concerned with prices for the physical bullion market, there is a price relationship between the companies that mine for gold and the price of gold itself. After all, we are talking about two different sides of the same sector.
So if options writers are anticipating the highest volatility of any sector in the world for the precious metals equities, we can be certain they are also expecting volatility in the value of their products, the underlying metals.
Takeaway on Gold
As we monitor the price action around $1,200 for gold over the coming week, let us remember that advances and retracements are expected to be increasingly volatile over the coming year, as new classes of investors enter the market. However, with volatility comes opportunity.
Those looking to avoid the expected gyrations this year would do well to consider a strategy of dollar-cost averaging into their positions over a number of months, while those on a more active trading program will benefit by keeping in mind the technical levels mentioned herein.
Christopher Aaron,
Bullion Exchanges Market Analyst
Christopher Aaron has been trading in the commodity and financial markets since the early 2000's. He began his career as an intelligence analyst for the Central Intelligence Agency, where he specialized in the creation and interpretation of the pattern of life mapping in Afghanistan and Iraq.
Technical analysis shares many similarities with mapping: both are based on the observations of repeating and imbedded patterns in human nature.
His strategy of blending behavioral and technical analysis has helped him and his clients to identify both long-term market cycles and short-term opportunities for profit.
Share:


