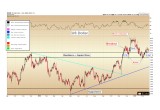
US Dollar must remain above 99.5 on the Index in order to avoid an extremely bearish reversal pattern.
The US Dollar Index, which measures the US dollar versus a basket of foreign currencies, is still perched precariously just above the breakout point of its 2015-2016 consolidation.
Closing the week at 101.1, the dollar must remain above 99.5 on the Index in order to avoid an extremely bearish reversal pattern, which is tentatively taking the shape of a Head & Shoulders top formation (blue call outs).
Image A
The initial surge in the dollar seen immediately following Trump’s presidential victory was accompanied by a sentiment which suggested the new administration would reverse trade deficits, boost growth, and cut the US national debt. Yet the sluggishness of the dollar’s advance in recent weeks suggests that the market is having second thoughts about this initial determination.
From a sentiment standpoint, a bearish outlook for the dollar seems to be a possibility few in the mainstream media are contemplating – and for that reason, it represents a compelling contrarian viewpoint.
Euro Fears? The Contrarian Stance
At the same time, reports regarding the possible breakup of the euro-zone have reached almost a fever-pitch, following the UK’s decision to leave the EU last June and uncertainty regarding elections across mainland Europe in 2017.
Image B
It seems “everyone” knows the euro is set to disintegrate over the next few years – and for that reason, we believe the trade is extremely crowded. As contrarians, when everyone knows that something is set to happen, we must at least ask the question: “Is there not an alternate possibility?”
While the Euro-zone clearly has a unique set of political/economic problems and may need substantial reforms, we must consider the possibility that most of this “news” is already priced in the currency.
Ironically, the fact that most investors are convinced of the euro’s imminent collapse leads us to strongly favor the stance that the euro is set to begin a multi-year advance.
And if the euro is nearing the start of a significant advance, the dollar should act conversely. As the largest component of the Dollar Index above is the euro (at 57%), a rising euro will cause the dollar to fall.
All else being equal, a falling dollar will tend to cause more investors to seek protection in gold.
We do not want to call the top in the dollar prematurely, i.e. before we see a breakdown below 99.5 on the Dollar Index. However, the US currency is acting significantly weaker than it “should” be acting, given the two-year consolidation is seen prior to the breakout.
Something is not right with the way the dollar is behaving technically. If it does not manifest immediately, our best assessment is that dollar weakness should become evident by 2018.
US Bonds
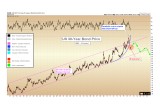
Bonds represent US dollars to be received in the future. We continue to suspect that a generational-timeframe top has been put in on long-dated US bonds. Shown below is the price of the US 30-year bond. Recall that the price of bonds moves opposite to yields, and so a record-high price equates to record-low yields.
Image C
From a technical standpoint, tops after long-term advances tend to be characterized by an orderly advance which then becomes disorderly.
In the case of US bonds, we had observed an unprecedented 36-year advance in price, defined by an orderly (magenta color) rising channel from 1980 – 2016. The advance in bonds then became disorderly, taking on characteristics of a parabolic blow-off, and breaking the upper trend boundary (shown in blue, above). The top saw a price of 175 on the 30-year bond, which corresponded to a record low yield of 2.1%.
Following the blow-off, we observed a quick 17% drop in bond prices in 2H 2016. Such a quick drop from an all-time high suggests an initial exhaustion sell-off after an unsustainable advance.
We are not expecting a collapse in bond prices immediately; however, if the above analysis is to remain valid, the 30-year yield at 2.1% should not be matched again – perhaps ever again in our lifetimes.
Following 36 years of rising bond prices, it is equally fathomable that the bond market could see 36 years of falling prices, corresponding to 36-years of rising interest rates.
Investors had become accustomed to buying bonds for safety over the last generation. Years of falling bond prices should represent an important component of the long-term thesis for precious metals, as some of that safety-seeking capital that in the past would flow to bonds will be diverted in the future toward gold.
The size of the US bond market alone is estimated to be near $12 trillion. Meanwhile, at $1,300 per ounce, all of the gold ever mined in the history of the world is valued at $6.6 trillion (and nearly 50% of that gold is held in jewelry, mostly in Asia). We can see that it would not take a huge percentage of capital to flow from bonds to gold to cause a major price acceleration in the precious metals.
Christopher Aaron,
Bullion Exchanges Market Analyst
Christopher Aaron has been trading in the commodity and financial markets since the early 2000's. He began his career as an intelligence analyst for the Central Intelligence Agency, where he specialized in the creation and interpretation of the pattern of life mapping in Afghanistan and Iraq.
Technical analysis shares many similarities with mapping: both are based on the observations of repeating and imbedded patterns in human nature.
His strategy of blending behavioral and technical analysis has helped him and his clients to identify both long-term market cycles and short-term opportunities for profit.
Share:

