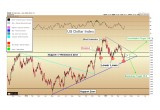
The US dollar abruptly reversed and moved higher last week, finishing up 0.8 points to close at 100.2 on the Dollar Index.
The US dollar remains at a critical technical juncture, and as the currency typically has an overwhelming impact on gold prices over the short-term, we place our primary attention there this week.
After seeming to break down during the overnight hours in Asia a week ago, the US dollar abruptly reversed and moved higher last week, finishing up 0.8 points to close at 100.2 on the dollar index.
The dollar is whipsawing traders at present and is caught immediately in the crosshairs of an important technical battle.
Despite the failure to follow-through in last week’s breakdown, the dollar remains within the zone of former support, which may now act as resistance, beneath 100.5 on the index. This zone is shown in black.
Image A
Dollar Continues to Make Lower Lows
The important point about the short-term technical picture is that the dollar has now put in three separate lower lows (99.5, 99.2, and 98.8) since the breakout from the 2015 – 2016 consolidation. This is not the sign of a market prepared to make another multi-year advance. The bids at the retest lows we observe (below 99.5) are not enthusiastic; rather, they are fading as time progresses.
In a strong breakout of a multi-year consolidation, we might indeed expect one or two retests of the former resistance zone. Yet following these retests, a market should move strongly higher to hit the consolidation target (which was calculated as 108 on the dollar index).
We have seen no such strength in the dollar since its breakout. Instead, we have seen three retests – each one occurring lower than the prior.
Image B
Could the Dollar Rally?
If the dollar does somehow manage to rally at this juncture – perhaps by some jawboning statement by the Federal Reserve about a “strong dollar policy” – we expect the US currency could stage a marginal final rally toward the aforementioned 108 target. If this does materialize, we expect to see precious metals not sell-off materially, but instead to show relative strength – perhaps consolidating with slight downward bias – as the dollar makes its terminal advance.
Essentially, the precious metals should anticipate that the dollar is in the final stages of its advance, whether or not the exact top print has already been posted.
In retrospect – this is exactly what gold and silver have done thus far during the past 15 months. Gold is up nearly $200 and silver up $4.50 even as the dollar is just shy of a 9-year high. We suspect buyers have entered the precious metals market ahead of time, knowing that the dollar was approaching an important multi-year top.
Short-Term Technical Considerations
The next few weeks continue to be critical to monitor for the dollar. On the chart above we can see that the US currency is now “sandwiched” between its rising (blue) trendline from the May 2016 low and its falling short-term trendline (teal) from the January high, all the while sitting squarely within the 2015 – 2016 resistance zone (black double lines). This is a tight technical situation indeed.
Gold Analysis
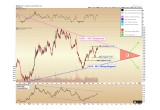
Gold advanced nominally last week, rising $2.70 or 0.2% to close at $1,251 as of the final trade on the New York COMEX on Friday afternoon. Minor resistance was seen as anticipated below $1,265. The high trade for the week came in at $1,262. Minor support levels exist at $1,200 and $1,180.
The near-term technical situation remains largely unchanged from our most recent update, and is focused upon the resolution of the pennant formation (red highlight) visible on the chart above.
As this pattern is drawing closer to a resolution, we will begin to regularly track the precise figures which would constitute a breakout in either direction. Those levels are:
Upper boundary breakout -- $1,290 and falling.
Lower boundary breakout -- $1,155 and rising.
Whichever of these boundaries breaks first, the resolution of this pattern will set the stage for the direction of the entire precious metals market for the subsequent 12-18 months. It will be an exciting remainder to 2017 to say the least!
Christopher Aaron,
Bullion Exchanges Market Analyst
Christopher Aaron has been trading in the commodity and financial markets since the early 2000's. He began his career as an intelligence analyst for the Central Intelligence Agency, where he specialized in the creation and interpretation of the pattern of life mapping in Afghanistan and Iraq.
Technical analysis shares many similarities with mapping: both are based on the observations of repeating and imbedded patterns in human nature.
His strategy of blending behavioral and technical analysis has helped him and his clients to identify both long-term market cycles and short-term opportunities for profit.
Share:


