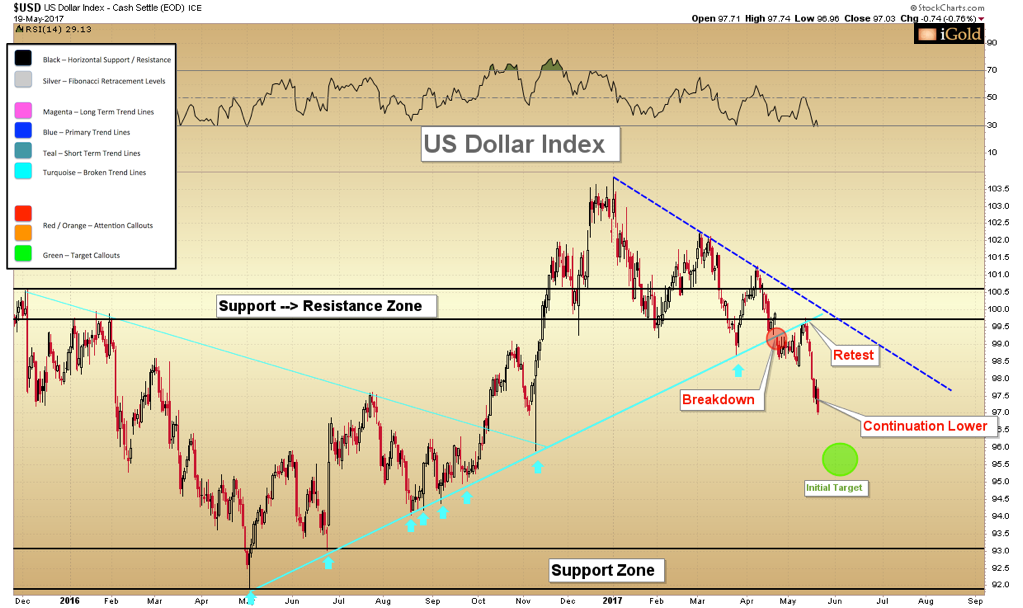
The dollar has now negated all of the post-Trump rally, returning round-trip to the 97 level on the dollar index, a process which has taken six months.
The big news across the currency markets this week was the large drop in the US dollar, which fell over 2% against a basket of currencies representing the US dollar index. The drop came on the heels of the announcement that the US government will launch a special investigation into alleged Russian connections with President Trump during last November’s election. While the investigation may take years to complete, the market has cast an initial vote by selling the US dollar in favor of other currencies, most notably the euro and yen.
Our focus here is not to dwell on the world political scene, but to illustrate the market reaction to these events, and to show how the currency crosspairs may impact the precious metals prices.
Image A
The dollar has now negated all of the post-Trump rally, returning round-trip to the 97 level on the dollar index, a process which has taken six months.
It is important to note that our analysis began to give hints that something negative was brewing for the dollar back in January, strictly based on interpretations of the chart. We observed lower lows forming in the dollar, and a failure to sustain a breakout to new highs in December, which came after a 9-year advance.
This failure of a market to move higher after an attempted breakout constitutes a “false breakout” in our technical model. When such a false move comes after a 9-year advance, it may signal exhaustion in a market, and a pending trend reversal in the opposite direction.
It is not until now, four months later, that the news has finally synched with the technical hints. This is almost always the case in technical-based market analysis: the move is observed first on the charts, and the news arrives some weeks or months later to explain the reasons why.
Short-Term Technical Considerations
The rising trendline from May 2016 has now clearly been broken to the downside (turquoise color, above). The retest failed a week prior (callout), and a continuation lower is now in process for the dollar.
Our initial target for the dollar is 95.5 on the index, highlighted above in green. This target is derived from measuring the amplitude of the failed move above the 99.5 former support level to the 103.5 peak (4.0), and subtracting this value below the breakdown point. The real-world interpretation of the target is that we expect an equal number of sellers to cut their losses below 99.5 as those who attempted to go long the dollar above this level.
As a confirming target, 96 on the index is also the 50% mid-point of the prior consolidation, which ranged from 92 to just above 100. When we have two technical targets within 0.5 points of one another, it increases the probability of the range being hit.
Dollar Intermediate-Term
The 95.5 level is an initial downside target only.
We have made the case in past issues that the false breakout above 100, which consisted of the entirety of the previous six months of post-Trump action, more importantly constitutes a long-term reversal after a 9-year advance in the USD.
While some level of bounce is expected after the initial 95.5 target is hit, we anticipate further intermediate and long-term downside remains.
Of course, this is a central component of the thesis for a precious metals bull market, as the strongest gains to come in years ahead should arive from a growing world-wide recognition that the world’s present “reserve currency” is a depreciating store of value.
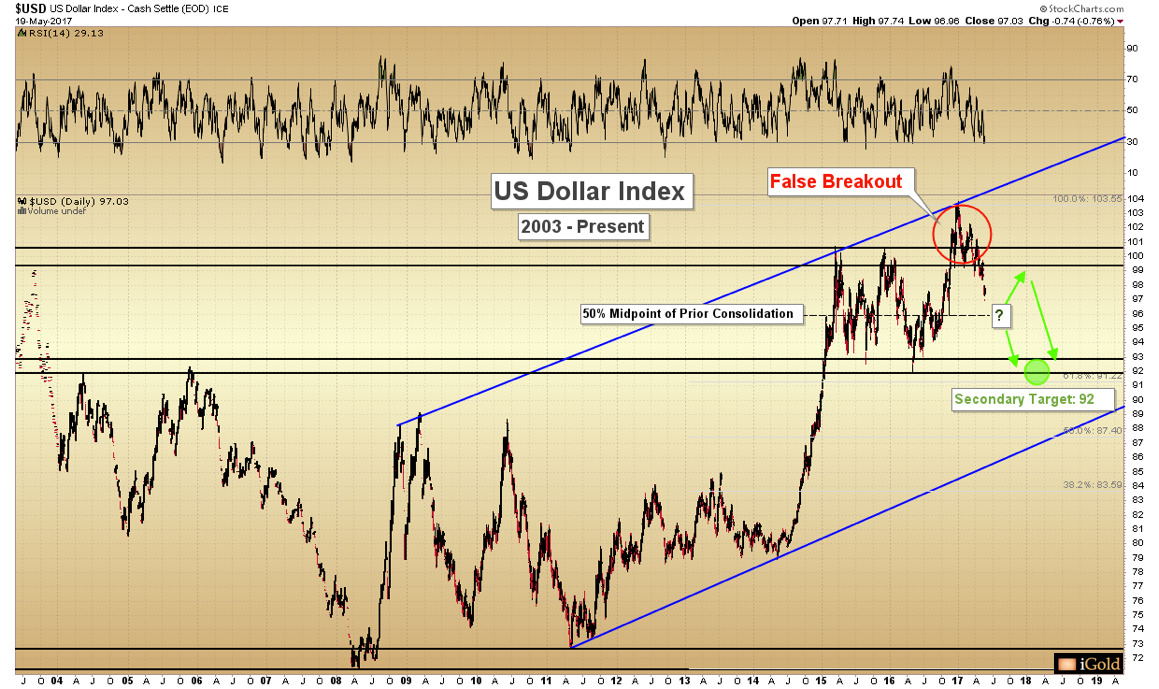
After a bounce at 95.5, our secondary target will be 92 on the dollar index. This level is critically significant for the US currency, as we can see from the 15-year chart below:
Image B
The 92 secondary target represents important long-term horizontal support (double black lines), which can be observed from the multiple spikes lower toward that level in 2015 – 2016, and more significantly in the resistance zones which date back to 2004 – 2005 (far left). Further, just below this level, 91.2 represents the 38.2% Fibonacci retracement of the entire 2008 – 2017 advance (light grey lines). Again, we have multple technical targets in this 91-92 region, and so the zone will take on important consideration.
The question that remains to be seen is: what sort of bounce will the market take between the initial target of 95.5 and the secondary target of 92? In an impulsive market decline, this sort of initial bounce may not last more than 1-3 months before sustained selling re-emerges.
Regardless of the exact legnth of the dollar bounce at 95.5 any price action that remains below 100.5 on the index will keep the technical criteria for a long-term top valid in the US currency.
A test of the 92 secondary target would thus be anticipated for Q3 – Q4 2017.
A break below 92 would be a strong confirming indicator of a new bear market materializing. Longer-term, we expect that the dollar will eventually make new all-time lows below 72, with the timing for this likely into the mid-years of the forthcoming decade.
Christopher Aaron,
Bullion Exchanges Market Analyst
Christopher Aaron has been trading in the commodity and financial markets since the early 2000's. He began his career as an intelligence analyst for the Central Intelligence Agency, where he specialized in the creation and interpretation of the pattern of life mapping in Afghanistan and Iraq.
Technical analysis shares many similarities with mapping: both are based on the observations of repeating and imbedded patterns in human nature.
His strategy of blending behavioral and technical analysis has helped him and his clients to identify both long-term market cycles and short-term opportunities for profit.
Share: