It is important for investors to follow the valuation of the US dollar because when the dollar sees periods of decline investors seek safety in gold.
It is important for precious metals investors to follow the valuation of the US dollar versus other foreign currencies because as a general principle, being the world’s reserve currency still to this day when the dollar sees periods of rapid decline investors tend to seek safety… and some of that safety flow will move into precious metals.
Below we chart the dollar index, which measures the greenback against a basket of foreign currencies including the euro, the British pound, the Japanese yen, and the Canadian dollar.
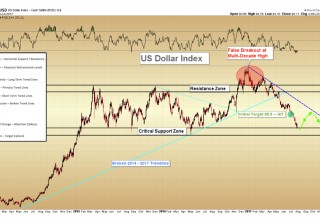
Since the false breakout at multi-decade highs last January, the US dollar has declined with such ferocious momentum that it has surprised even our initial outlook from this past spring. Our initial target to the downside was 95.5 (green callout) and this level has not only been hit but exceeded. In the wake of a dovish indication from the Federal Reserve last week that it may not desire to “normalize” its balance sheet as quickly as many assumed, the USD has continued to plummet all the way down to the nearly 3-year “Critical Support Zone” labeled below in black. This zone extends from 91.9 to 93.1 on the dollar index.
Image A
Having closed at 93.1 for the week, the dollar is now effectively testing this critical support zone.
Dollar Set for a Technical Bounce
Over the short term, we would expect the dollar to bounce in this region. The nature of the bounce will be important to monitor. The false breakout pattern at a multi-decade high is a rare and significant technical signal for a possible long-term reversal, and so we expect that a bounce from current levels for the dollar will not be anything more than a relief rally, not to exceed the declining (dashed blue) downtrend line. This scenario is highlighted in green.
A less probable scenario would be that the dollar stages a more significant relief rally which breaks its new downtrend, but which does not exceed the resistance zone between 99.5 – 100.5.
The strength of the expected bounce will tell us much about the dollar going forward. Should the dollar stage a larger rally, it will be signaling that the decline we expect over the coming years will be slower and more grinding in nature, perhaps taking an equal 8-years to fall to all-time lows near 72 on the index, levels last seen in 2008.
However, should the dollar merely show a weak bounce, staying below its new trendline, not exceeding 95.5 on the way higher and then plunging through the critical support zone, the stage will be set for a more immediate and precipitous drop in the US currency over just the next 12 months.
Take, for example, the period to the far left of the chart from mid-2014 to early-2015, in which the dollar rose from 80 to 100.5 within eight months. It is entirely conceivable that in a precipitous dollar decline, the greenback could return just as quickly to the 79-80 region over a similar time frame. This would equate to nearly a 15% further drop in just a year.
Long-Term Dollar Indicator
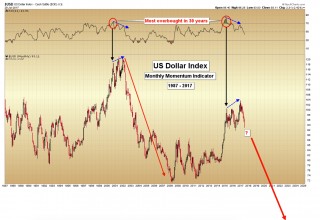
Consider our monthly momentum indicator for the dollar, dating back to the mid-1980’s. According to this model, the top just seen in the dollar was the most significant of the past 30 years, registering an even more overbought reading than the 2001-2003 top.
For reference, recall that the decline which began in the dollar in 2001 at 118 on the index coincided with the all-time low in gold at $255 per ounce.
Image B
Consider, too, that the decline which followed the 2001 top resulted in over a 40% loss in the value of the dollar in just six years. Were such a percentage decline to occur again from this greater-magnitude signal, the target would be 62 on the index by 2023, or of the Y-axis below the chart.
Metals Have Not Responded to USD Weakness… Yet
Of course, what remains to be seen is: when do gold and silver begin to respond to the dollar’s decline? From 2003 – 2008, there was a strong day-to-day inverse correlation between the dollar and gold. Recently, however, precious metals traders have been largely ignoring the bulk of the decline in the US dollar up to this point.
When will traders begin to notice the decline in the world’s reserve currency? We cannot say for certain, but we will begin to pick up the change in behavior when it registers on the charts, as we should begin to see $10 - $20 spikes in gold on specific days when the dollar falls by 0.5% - 1.0% on the index.
Whichever form the pending bounce takes will tell us much about the strength or lack thereof for the dollar to be expected over the next several years.
Christopher Aaron,
Bullion Exchanges Market Analyst
Christopher Aaron has been trading in the commodity and financial markets since the early 2000's. He began his career as an intelligence analyst for the Central Intelligence Agency, where he specialized in the creation and interpretation of pattern-of-life mapping in Afghanistan and Iraq.
Technical analysis shares many similarities with mapping: both are based on the observations of repeating and imbedded patterns in human nature.
His strategy of blending behavioral and technical analysis has helped him and his clients to identify both long-term market cycles and short-term opportunities for profit.
This article is provided as a third party analysis and does not necessarily matches views of Bullion Exchanges and should not be considered as financial advice in any way.
Share:


