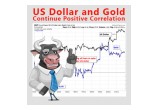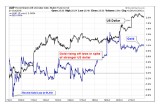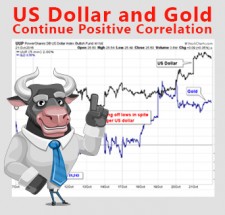
The positive correlation we were monitoring last week between the US dollar and the gold price has become even more pronounced since the last update. The US dollar, as measured by the Dollar Index, has continued to rise toward medium-term resistance on the charts near the 100 level. Meanwhile, gold is refusing to break down below its recent low of $1,243 set on October 7.
These time periods in which both the US dollar and gold move in the same direction are rare, but not unheard of altogether. They tend to happen during one of two main scenarios:
1) Market panics — when both assets are viewed as safe-havens, and rise simultaneously (or after the panic ends, when both fall simultaneously).
2) At major inflection points — when one market is advancing, but the other market does not “believe” the legitimacy of the other market’s move.
We see no panic in the stock or currency markets recently, so it appears that as of today, it is gold which is not believing the US dollar’s continued advance.
The update below continues from our chart last week, and shows both gold and the US dollar since the recent gold low of $1,243 on October 7 (UUP is the proxy ETF for the US dollar index, GLD the proxy for gold):
(See image A)
In the absence of a market panic, this simultaneous movement by both gold and the US dollar in the same direction will not last forever.
One of these markets will soon be proven “wrong”.
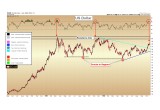
Should the dollar continue to advance toward the 100 level while gold remains firm, the precious metal will be signaling that the dollar is due to put in its final medium-term top of the nearly 2-year consolidation shown below, before the next reversal should take it below 92 into 2017:
(See image B)
However, should the dollar advance above 100 in a meaningful way, we would need to monitor the action in gold closely, as it could represent a major headwind for the precious metals market for at least the next year.
As of present gold continues to show little respect for the dollar’s advance.
Note that on the chart above, the RSI indicator (top section) has once again approached the overbought level above 70, which has marked previous tops in the dollar to within a few weeks through 2015.
Because the dollar is approaching important long-term resistance, we will continue to show the dollar/gold relationship on a regular basis over the coming months. Especially with the possibility of a Fed interest rate hike before the New Year, and with the US election only two weeks away — the major currency markets are primed for trend-setting action through December.
(See image C)
Gold Update
As of the New York COMEX close on Friday afternoon, gold had gained $12.20 for the week or nearly 1%, to close at $1,267.70.
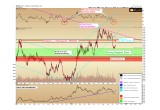
Looking ahead, initial resistance will be showing up in the former support zone which was broken during the early October decline, between $1,285 and $1,305. With a high probability, we expect buyers will need at least two distinct attempts to break through this resistance level.
For support, we are looking for gold to continue stabilizing above or within the zone of $1,200 – $1,251, shown below in the green band. If gold can maintain the recent October 7 low of $1,243 as the bottom for this correction, it will be setting up a bullish posture to overcome the declining long-term downtrend (magenta color) as early as December, and at latest by March.
We continue to believe the overcoming of this long-term downtrend will represent a major shifting point in the psychology of the precious metals market, and should precede a significant dollar-negative event by 6-12 months.
We note that the RSI indicator (top of chart) had become the most oversold since just prior to the December 2015 bottom. In a bull market, RSI readings below 30 generally signify medium-term bottoms, although this does not preclude the possibility of further time needed within the support zone over the coming months.
*****
As the US election is just over two weeks away, during the next two weeks we will have increased commentary on how the election results may impact the markets, most notably the US stock market, and of course the precious metals.
Christopher Aaron,
Bullion Exchanges Market Analyst
Christopher Aaron has been trading in the commodity and financial markets since the early 2000’s. He began his career as an intelligence analyst for the Central Intelligence Agency, where he specialized in the creation and interpretation of pattern-of- life mapping in Afghanistan and Iraq.
Technical analysis shares many similarities with mapping: both are based on the observations of repeating and imbedded patterns in human nature.
His strategy of blending behavioral and technical analysis has helped him and his clients to identify both long-term market cycles and short-term opportunities for profit.
This article is provided as a third party analysis and does not necessarily matches views of Bullion Exchanges and should not be considered as financial advice in any way.
Share:

