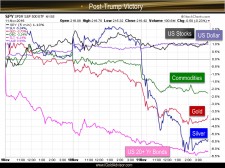
Donald Trump clinched an unexpected victory for the US Presidential election on Tuesday, which sent major world markets into a temporary panic. Gold surged, stocks dropped limit-down in the overnight hours, and it appeared gold was on the verge of the technical breakout from the long-term downtrend that we have been monitoring for almost half a year now.
Yet just 12 hours after the election results became known, the markets saw quick reversals of the prior movements, with precious metals and other safety assets being dumped, and risk assets including broad stocks and industrial commodities being bought strongly.
We remain long-term bullish on precious metals for the fundamental reasons that we all know to be true: central bank money printing, government bailouts of private corporations, uncontrollable debt, and negative interest rates in several major nations worldwide.
Yet the challenge at this moment is to come back to a central investment principle: do not fight the market.
What this means is that, as individuals and investors, we may have opinions on what the market should do. We may have fundamental data from sound research to back up those opinions. We may have done thorough due diligence. Yet despite all this, if the market moves opposite to our fundamental research, we must consider that there is more information impacting the market than we are factoring into our equations.
The old investment adage is helpful to remember: “The market can stay irrational longer than you can stay solvent.”
Markets Turn After Trump’s Victory
Immediately in the aftermath of the Trump election victory, most major world markets reversed course abruptly and strongly.
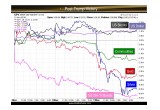
Gold and silver, which were up significantly in the hours after Trump’s win was decided, reversed suddenly and finished lower for the week. Gold hit a high of $1,335 in the early morning hours on Wednesday, only to close the week near $1,225, almost a $110 drop in just over 48 hours.
(See image A)
Similarly, the US dollar and the US stock market, which were showing 2.5% and 5% losses in the overnight hours after the election, reversed course and both finished higher by over 1%, respectively. These are notable intra-week swings.
But it was not only gold and precious metals that fell after the initial surge on Tuesday night. Long-term 20+ year US bonds also dropped, falling over 6% in the last three trading days of the week. This is a huge drop for the bond market, to the extent that 20-year interest rates rose from 2.26% to 2.58% in just one week. This is one of the largest single-week drops in bond prices / increase in bond interest rates seen in the last 20 years.
In sum, after the initial fear reaction as a result of Trump’s victory, most major markets did a 180-degree turn and reversed. Safety assets were sold across the board, and risk assets recovered to turn positive.
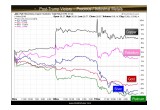
Let us switch the above chart to view the action in metals only. We are including both precious and industrial metals in the following chart.
(See image B)
First, we see that copper was the outstanding performer this week, indicating demand for the industrial metals was seen as positive after the Trump election. Palladium came in second, which is, of course, a precious metal with major industrial demand, especially from the automotive industry.
In contrast, gold, silver, and platinum all fell, the first two being the historic monetary metals.
It appears that markets are pricing in increased industrial demand from the Trump administration and a lesser need for safety assets. We can only speculate as to the reasons for this — we wonder (half-jokingly): is the wall that Trump intends to build along the US-Mexico border going to be made primarily of copper?
Silver is the outlier. As we know, silver’s demand equation still is composed of roughly 80% industrial usage. Why did silver fall more than gold, and not finish the week somewhere in between gold and copper (as it “should” when safety assets fall but industrial assets rise)? What happened to the industrial silver buyers?
Manipulation theories aside (we do not completely discount them, but do not consider them sufficient for making investment decisions), based on the declines seen in US bonds, gold, and platinum, we can only conclude that silver saw large selling from those who were previously holding the metal for its safety / monetary role. We may not agree with their decision to sell, but sell is what they did.
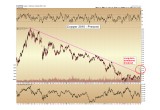
A quick view of the copper chart from 2010 through present reveals the significance of the surge seen in the primary-industrial metal this week: no less than a breakout from the long-term declining trendline since the 2011 highs. [Note: this is the same relative trendline that has been so elusive for gold, from which it has failed to break higher for the past five months. From the copper surge seen this week it should be apparent why we place emphasis on the potential breaking of these long-term trends.]
(See image C)
In sum, copper was up an incredible 10.7% for the week and looks like it is entering a new bull market after five years of declines.
Gold Analysis
For the week, gold price per ounce fell $80 or 6.1% to finish at $1,224. Yet more significant was the nearly $110 swing from $1,335 on Wednesday to the Friday close.
The Wednesday reversal consisted of the highest ever single-day volume of contracts traded on the New York COMEX exchange, at 780,000. This is nearly four times the average daily volume.
Because this historic volume occurred on a reversal day, the $1,335 high is going to require multiple attempts or an equally-high record-breaking volume surge to break through this level on any subsequent rally.
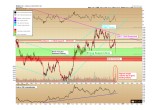
Viewing gold technically, the metal is making a lower low within the strong support zone that we would expect to hold if gold is still in a new bull market. This zone extends down to $1,200, precisely.
(See image D)
The “Must Hold Zone”, as defined by $1,173, the 61.8% Fibonacci retracement of the advance, would be the lowest level that we have observed new bull markets to fall while still being in a primary overall advance. A break below that level and quick retests of $1,045 would occur at minimum.
Christopher Aaron,
Bullion Exchanges Market Analyst
Christopher Aaron has been trading in the commodity and financial markets since the early 2000's. He began his career as an intelligence analyst for the Central Intelligence Agency, where he specialized in the creation and interpretation of pattern-of- life mapping in Afghanistan and Iraq.
Technical analysis shares many similarities with mapping: both are based on the observations of repeating and imbedded patterns in human nature.
His strategy of blending behavioral and technical analysis has helped him and his clients to identify both long-term market cycles and short-term opportunities for profit.
This article is provided as a third party analysis and does not necessarily matches views of Bullion Exchanges and should not be considered as financial advice in any way.
Share:

