Summer slow time of year for most of the financial markets is over.The strong seasonal period begins in August and continues through September.
As summer winds down in the northern hemisphere, first and foremost our thoughts and prayers go out to those who are being impacted by the destruction of Hurricane Harvey in Texas.
Summer tends to be the slowest time of year for most of the financial markets. The phrase “sell in May and go away” summarizes the strategy that many traders take of exiting their positions at the end of the spring and not returning until after Labor Day. Although the precious metals occupy a unique space within the investment world, some of these same seasonal factors do impact the prices of the metals.
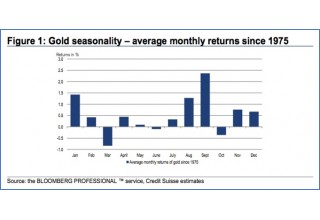
Let us examine the gold seasonality chart, showing average monthly returns since 1975:
Image A
As we can see, the May through July period is historically the slowest of the year for gold, featuring not only the lowest volatility but often an important price low forming in July.
The strong seasonal period begins in August and continues through September, largely as a result of physical demand from the Indian wedding and Chinese holiday seasons.
However, we should point out that after what is typically a weak month in October, gold still has four strong months ahead through February.
In sum, the August through February period is the strongest time for precious metals historically, and we are now at the beginning of that period, with gold already having broken through its long-term downtrend technical resistance (see the article, last week).
Volatility Remains at Record Lows
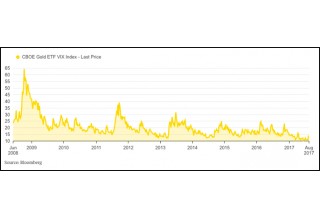
Let us not forget, gold is approaching its strongest period of the year amidst what is still the lowest daily volatility observed over the past nine years. Below we update gold’s volatility chart:
Image B
Volatility is a direction-neutral measure. In other words, it only tells us that a period of higher volatility is set to follow, but not in which direction the upcoming moves will occur.
When we juxtapose strong seasonality factors emerging amidst a market that is within record-low volatility and already showing initial hints of technical breakouts, what we can say is that the precious metals are set for strong moves ahead. Our initial assessment is that those moves will be higher, but we will not take anything for granted and always keep one eye on the charts on a regular basis.
The charts we feature here focus primarily on the “what” aspect of the market – they do not tell us the “why”. The metals are like dry tinder at present with lightning visible in the distance. The market is waiting for a spark… what could that be?
Potential Sparks for Gold
Tensions are brewing amongst US economic policymakers, and Janet Yellen, the chairwoman of the Federal Reserve, gave an example of that on Friday. In a speech at the economic symposium in Jackson Hole, Wyoming, Yellen discussed the role that the US central bank had in propping up the financial system after the crash of 2008 through bailouts and increased regulation. The most prescient quote from the speech was as follows:
“Because of the reforms that strengthened our financial system, and with support from monetary and other policies, credit is available on good terms, and lending has advanced broadly in line with economic activity in recent years, contributing to today’s strong economy.”
Here we see Yellen hinting that she will not favor the loosening of regulations that were enacted after the financial crisis of 2008, something the Trump administration has pushed for in recent months.
Yellen’s term as chairwoman is up this February and speculation is that Trump may not re-nominate her for the position. The speech at Jackson Hole tends to reinforce that a shakeup may be coming at the Fed early next year. And uncertainty in the financial system tends to provide support for gold.
Meanwhile, saber-rattling continues between the United States and North Korea. While gold price spikes based on the fear of isolated geopolitical events tend to not be sustained, certainly if any sort of extended political or military confrontation were to develop between these two nuclear powers, gold would see a sustained bid. At what point do these idle threats that we see quoted so often begin to be taken seriously by one side or the other?
Image C
Takeaway on the End of Summer and Gold
Initial technical breakouts have already been observed on the charts in recent weeks. Gold is entering its historically-strongest period of the year due to seasonal demand from India and China, amidst a backdrop of decade-low volatility. The precious metals are set to react strongly when a fundamental spark presents itself.
Enjoy your final week of the summer!
Christopher Aaron,
Bullion Exchanges Market Analyst
Christopher Aaron has been trading in the commodity and financial markets since the early 2000's. He began his career as an intelligence analyst for the Central Intelligence Agency, where he specialized in the creation and interpretation of pattern-of-life mapping in Afghanistan and Iraq.
Technical analysis shares many similarities with mapping: both are based on the observations of repeating and imbedded patterns in human nature.
His strategy of blending behavioral and technical analysis has helped him and his clients to identify both long-term market cycles and short-term opportunities for profit.
This article is provided as a third party analysis and does not necessarily matches views of Bullion Exchanges and should not be considered as financial advice in any way.
Share:


