Our market review shows that silver price finished higher last week (about 16,04 per ounce) and continues recovering over the intermediate-term.
To review the primary operating motive of this series of articles: there are hundreds of fundamental factors driving the precious metals markets (currency debasement, potential stock market declines, geopolitical instability, jewelry demand, and industrial fabrication being the major ones). However, no one can ever know the sum of all fundamental factors impacting a market. To attempt to do so would require complete knowledge of all the factors impacting of each and every single participant in the international market. Such is an impossibility.
Yet the one place in which every market participant comes together – no matter what his or her specific fundamental belief – is in the decision to buy or sell at a specific price point. Price is where the sum of all market participants converge.
Thus, by studying price foremost, we can observe what is actually happening in the market by filtering out the ‘noise’ that so often accompanies fundamental-only analysis. And by observing trends in price – the sum of the buyers and sellers – we can align ourselves with the strongest ones in an attempt to profit.
Silver Price Update
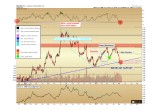
Let us take a good look at silver this week. Silver price finished higher last week by $0.13 cents to close at $16.40 as of the final trade on the New York COMEX on Friday afternoon, a gain of 0.8%. On the very short-term, the RSI momentum indicator (top of chart), which had registered the most oversold reading since the 2015 bottom, correctly gave us a warning of this bounce that is underway.
Image A
The question of how far this advance continues remains to be seen. We would like to see silver regain its broken rising linear trendline (dashed blue), by maintaining a weekly close above $16.50. Such would register the recent break as a “false breakdown” at the most-oversold reading in nearly two years, which would solidify this low as an important medium-term bottom.
Conversely, if $16.50 fails to be regained again over the next two weeks and silver tops out below the broken trendline, we will consider this a sign of caution.
A sign of caution does not mean we negate the entire thesis for a Q3 – Q4 breakout in the metals. It would suggest, however, that silver could continue to lag throughout the initial stages of gold’s advance, perhaps failing to exceed its 2016 high ($21.25 ) within the same immediate time as when gold finally exceeds its relative $1,378 peak.
Support lines between $16.75 - $17.25 has been removed from the silver chart above from the version from several weeks ago because, after serving as an important magnet for prices on four successive junctures from last October through the previous week, the zone failed to hold during the most recent decline. For whatever reason, a new group of sellers have shown up and/or buyers did not appear within that range as we had observed them previously, and so we must adjust our perspective and outlook accordingly.
On the positive side, because this level is no longer a support zone, it will also no longer be a resistance level as silver moves higher. Sellers should be largely absent within this region.
There is little in the way of resistance until $17.75, which becomes our target on a recapturing of the broken blue trendline at $16.50. This was the pivot low from the April correction.
Over the long-run, we have targets much higher than $17.75. However, over the short run this should serve as short-term resistance. Silver must at minimum consolidate above Important Support labeled at $15.75 to keep the bull market thesis intact during the remainder of 2017. A break below this level would signal a major red flag for gold and cause us to have to rework the 2017 – 2020 long-term model.
SLW / SLV Ratio
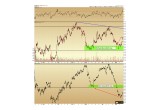
We often use the ratio between large-cap silver miners and silver bullion itself to gauge short-term pivot points in the metals. Silver Wheaton (SLW) is our large-cap miner of choice, a sector leader across most timeframes. Below we update the chart, with SLW on top and SLV (silver bullion proxy) immediately below. Note that SLW now is firmly within the 2017 mid-consolidation (above the green support band), while silver itself is well below its correlated price zone.
In essence, SLW often discounts short-term price movements that will not last in the underlying silver market.
image B
This leading indicator is calling for a continued recovery in silver over the intermediate-term, although please note that this signal can sometimes occur early, i.e. immediate weakness in silver can occur for the first few days, and then the recovery begins. Those looking to do short-term trading in silver should use other confirming technical indicators such as momentum and trendlines analysis.
Christopher Aaron,
Bullion Exchanges Market Analyst
Christopher Aaron has been trading in the commodity and financial markets since the early 2000's. He began his career as an intelligence analyst for the Central Intelligence Agency, where he specialized in the creation and interpretation of the pattern of life mapping in Afghanistan and Iraq.
Technical analysis shares many similarities with mapping: both are based on the observations of repeating and imbedded patterns in human nature.
His strategy of blending behavioral and technical analysis has helped him and his clients to identify both long-term market cycles and short-term opportunities for profit.
Share:


