After silver "flash crash" last week, we believe over the long run, silver will eventually be moving higher.
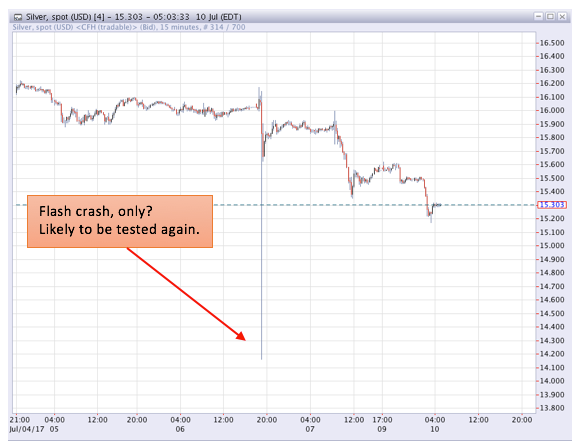
Silver saw a “flash crash” on Thursday night EST / Friday morning in Asia, falling momentarily by at least $1.50 before recovering somewhat during the day.
The actual low print is up to some debate, depending on which exchange and contract one refer to the low bid for the spot market (shown below) according to our trading desk was $14.16, while some other platforms are showing the low as $14.50.
Image A
We will be conservative and call the low $14.16. Either way, clearly the exchanges were overwhelmed with whoever decided to sell such a quantity of silver in such a short period.
Many futures traders were stopped out at significant losses during the "flash crash". However, as discussed in recent articles, we have been monitoring negative leading signals in both the CRB commodity index and the gold/silver ratio for the past month, and so we were largely expecting the recent drops in metals prices.
Several analysts are calling this "flash crash" the final bottom for silver’s recent decline: they are likely premature in these calls. It is important to understand what happens during a "flash crash": someone dumps a huge amount of paper silver on the market at a single instant. Stops are taken out, and selling begets further selling as traders panic to avoid losses. The selling only stops when a significantly large entity – who is using lower leverage and thus does not run the risk of being stopped out by the waterfall decline – steps in with a sufficiently-large bid to absorb all the panic selling.
The good news is: we now know where large entities are willing to buy silver. That figure is down near $14.16 or slightly above.
The bad news is: that level is likely to be retested at least once, if not on multiple occasions over the next 3-6 months. In a worst-case scenario, the large bidder will be exhausted (though he will have absorbed most of the sellers), and a final low will occur marginally below the bidder’s established price ($14.16 at the lower range).
In sum, we have here, in this flash crash, a strong piece of evidence to suggest that the low for silver’s current decline will occur in the low-to-mid $14 range. We will, of course, use other forms of technical analysis to zero in on this low as it approaches.
On Manipulation
As a final note on silver: yes, we would consider this type of selling to be “manipulation” of the markets, by some entity. However, our goal is to be pragmatic: such manipulation is going to occur periodically in silver, so let us at least protect ourselves and possibly profit from these occasions, as opposed to standing by as mere victims as many commentators seem content to do in the precious metals world.
Over the long run, silver will eventually be moving higher.
Silver Intermediate Outlook
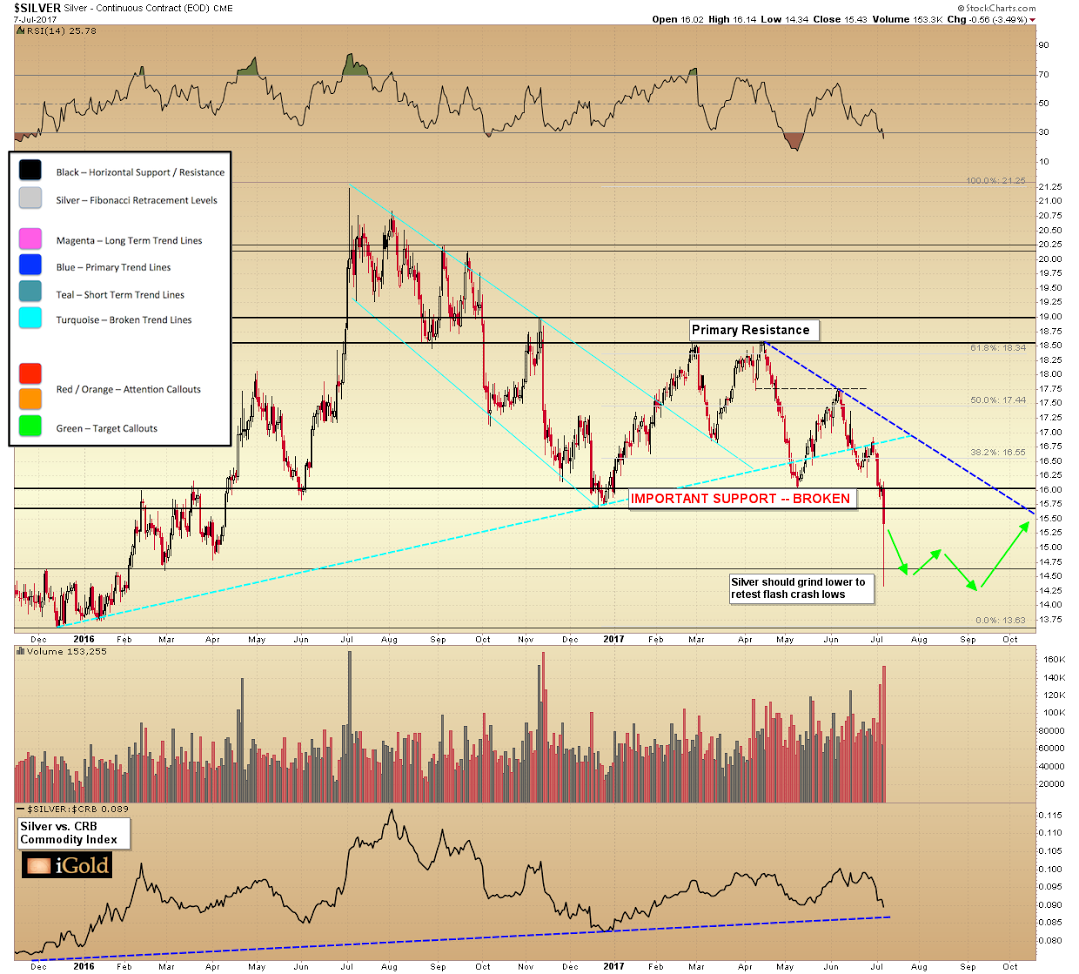
Turning to the silver chart itself, for the week gold’s cousin fell $1.20 or 7.2%, to close at $15.43 as of the final trade on the New York COMEX on Friday afternoon. The technical damage is reflected on the near-term chart and outlook:
Image B
Our view is that, in percentage terms, the majority of silver’s decline is already behind us. A final drop to the low $14’s or mid $13’s would not constitute a significant further percentage drop – but it would sufficiently harm investor sentiment such that a functional retest of 2015 lows could mark the most important buying opportunity for the remainder of the decade.
The advance that occurs following a double-bottom scenario of the $13 - $14 region (equivalent to the 2015 lows) should be just as strong as the surge that began in first-half 2016… so let us remain prepared.
Christopher Aaron,
Bullion Exchanges Market Analyst
Christopher Aaron has been trading in the commodity and financial markets since the early 2000's. He began his career as an intelligence analyst for the Central Intelligence Agency, where he specialized in the creation and interpretation of the pattern of life mapping in Afghanistan and Iraq.
Technical analysis shares many similarities with mapping: both are based on the observations of repeating and embedded patterns in human nature.
His strategy of blending behavioral and technical analysis has helped him and his clients to identify both long-term market cycles and short-term opportunities for profit.
Share: