The technical roadmap for silver is mixed over the short-term but is setting up positively for late-2018.
Silver diverged from gold over the past week, falling slightly by $0.14 cents, or 0.8% for the week. The final trade for the New York COMEX futures was $17.14, although silver continued to advance in the electronic access market up to $17.20 by 5:00 pm EST.
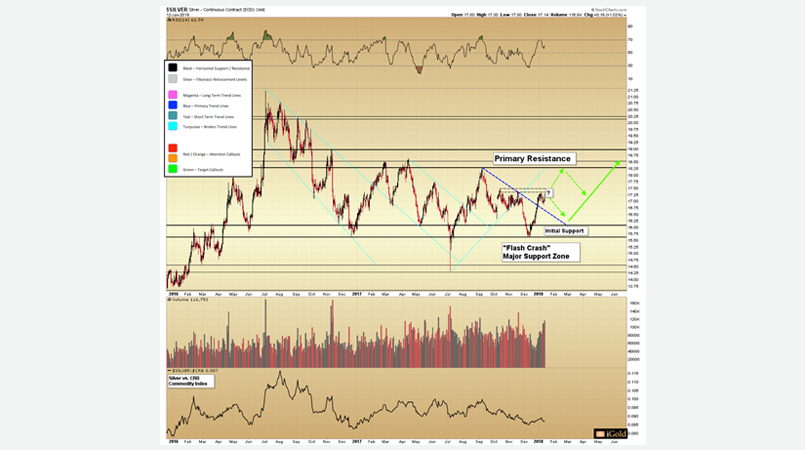
The technical roadmap for silver is mixed over the short-term but is setting up positively for late-2018 and into 2019. Refer to the following primary chart:
Image A
We see that the minor resistance between $17.30 - $17.50 (dashed black lines on the chart) is causing a pause in silver’s advance. If buying is sufficient to overcome this level, we expect silver will “pop” quickly to the $18.30 - $19.00 Primary Resistance zone. However, if gold itself tops out below 2016’s peak of $1,378, silver will lack follow-through and this minor resistance will represent silver’s short-term peak for this advance.
Most indicators are firmly neutral:
- Short-term RSI (Relative Strength Index, top of chart) is neither overbought nor oversold.
- Silver underperformed gold this week, causing a rise in the gold to silver ratio (GSR) from 77.1 to 77.9. While an increase in the GSR is generally negative for both metals, we must remember that it is quite normal for silver to lag gold for several months and up to a full year during each primary wave higher amidst a bull market. As a net sum, the ratio should be falling over time.
- Volume for silver was nearly 514K contracts traded for the week, which is the highest weekly total since November 2016, when 577K contracts were exchanged. This occurred on a net down week, which is a negative indicator. However, when we parse the data, we see that the highest single volume day of the week occurred on Friday, which was a strongly positive day, at nearly 117K contracts exchanged. Thus, we cannot say that weekly volume was negative as a whole.
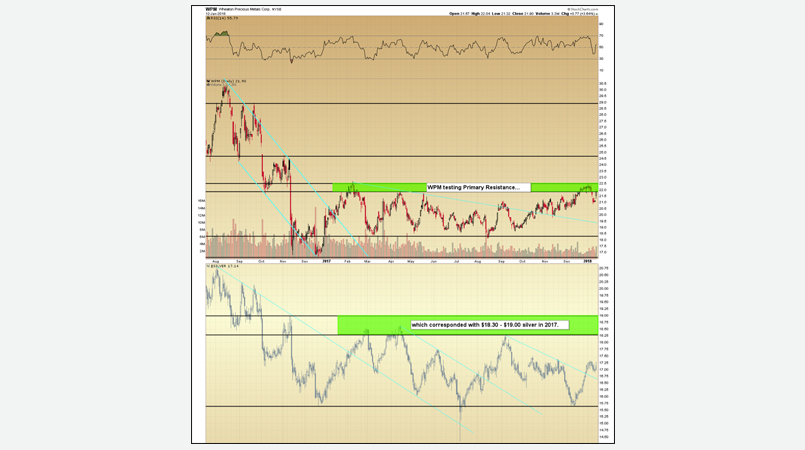
- At right, our Wheaton Precious Metals (formerly Silver Wheaton) model remains strong and is pricing in a return test of $18.30 - $19.00 Primary Resistance over the short-term. Note how the green-shaded zones correspond to this market-leading silver streaming company (WPM, top) and its primary product (silver, bottom):
Image B
As technical analysts, a critical facet is to recognize when we have mixed signals at a short-term juncture, and this is the case in silver presently.
Whether or not silver advances first to Primary Resistance, or declines first toward the now-broken (blue) trendline at $16.60 and/or Initial Support at $16.10, we expect both of these trajectories will end up with the same result no later than Q2, which is: a fifth challenge of Primary Resistance, en route to a breaking of 2016 highs by late 2018 / early 2019.
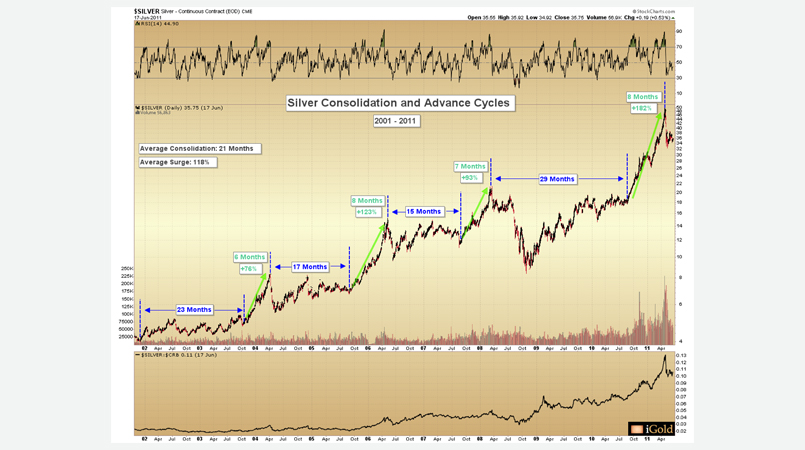
In sum, the average of silver’s consolidations from 2001 – 2011 was 21 months. The average advance from the consolidations breakout point was 118%, lasting 6.8 months.
Let’s recall: silver’s first-half 2016 surge registered 155% -- and it has now been consolidating for 18.5 months since July 2016.
Silver’s Consolidation and Advance Pattern
A note for new investors in the sector: it is normal for silver to consolidate for 15 - 30 months following a 6 – 8-month surge. The “work” in silver investing comes during these consolidations. When prior highs are finally exceeded, there is typically little time to establish positions. Let’s view these historical patterns from the 2001 – 2011 cycle:
Image C
In sum, the average of silver’s consolidations from 2001 – 2011 was 21 months. The average advance from the consolidations breakout point was 118%, lasting 6.8 months.
Let’s recall: silver’s first-half 2016 surge registered 155% -- and it has now been consolidating for 18.5 months since July 2016.
Takeaway on Silver
We cannot predict the future, but we can say that repeating patterns exist for a reason. Based on these patterns, the next year appears ripe for silver’s second surge from the 2015 lows.
Let’s be prepared before it happens.
Christopher Aaron
Bullion Exchanges Market Analyst
Christopher Aaron has been trading in the commodity and financial markets since the early 2000's. He began his career as an intelligence analyst for the Central Intelligence Agency, where he specialized in the creation and interpretation of pattern-of-life mapping in Afghanistan and Iraq.
Technical analysis shares many similarities with mapping: both are based on the observations of repeating and embedded patterns in human nature.
Share: