SIlver price dropped more than 1 percent on Friday to a 5-month high as investors sought safe-haven assets after the United States launched cruise missiles on a Syrian air base
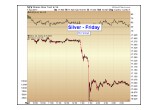
Friday saw a dramatic day in the precious metals market. In the aftermath of the US retaliatory strike on Syria, gold and silver both rose sharply higher in the overnight hours early Friday morning, only to reverse lower by the close of trading for the week.
In general, short-term political and/or terrorism-related market reactions tends to be short-lived. Friday proved to be no exception. Let us turn to an examination of the silver market, which saw the most dramatic move on Friday.
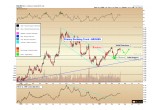
For the week as a whole, silver underperformed gold, finishing lower by $0.30 cents or 1.7%. The final trade on the New York electronic access market was $17.96.
Image A
By failing to overcome the $18.50 - $19.00 initial resistance zone (black lines), this resistance level takes on increasing importance going forward. On any further weakness, we expect the $16.75 to $17.25 region to act as support at the low range.
Image B
The trading on Friday is worthy of further discussion. There has been mention in other areas within the precious metals investment world that the decline on Friday was entirely due to “manipulation.” On the surface, when we examine the intraday price action, it appears clear that this was not a normal trading pattern.
On Manipulation
If you are reading this article, you have demonstrated an interest in profiting from these markets, and not simply sitting idly as a passive victim of manipulation. We aim to thrive, not to be victims.
If a market is so manipulated that it can never advance in our favor, we should move onto another market. The reason we are involved in the precious metals is because we know that the sum of the participants are ultimately stronger than any attempts at suppression. Manipulation may exist, but it is not stronger than the market itself.
It is no coincidence that the above selling took place just below the $18.50 level. Our charts had previously identified this resistance level. This was an important swing high from February, and sellers are appearing in this region once again.
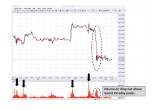
We now switch over to the trading desk chart to examine the intraday volume on Friday:
Image C
A buying gap did indeed appear in the trading on Friday afternoon.
However, the volume on Friday’s decline was not abnormally high. As can be seen on the chart, volume was higher at times during the consolidation and advance of the preceding two days.
When a drop such as this happens on moderate volume, it indicates sellers were met with relatively few buyers – not that an inordinate amount of sellers appeared. Such a reversal lower on moderate volume indicates that buyers were exhausted from the previous advance… and when buyers become exhausted, by definition it is sellers who remain. Thus, even a moderate volume of selling can cause a significant drop such as on Friday.
This is exactly the type of trading action that constitutes a consolidation. Sellers are making it clear where they desire to sell, and now we take a step back and observe where the next round of buyers show up. At each successive attempt to overcome the $18.50 - $19.00 resistance zone, futures contracts and physical metal are transferred from weak hands to strong – and when enough silver has been transferred in this way – the next advance will see an absence of sellers at the aforementioned resistance zone. The price can then advance to a new relative high.
Consolidations such as this are extremely healthy. Linear advances higher tend to not be sustained, as we saw in 1H 2016. To the contrary, advances followed by consolidations allow a market to move higher over the long run without drawing too much attention and without the extreme swings seen last year.
Longer-term investors should not be fearful to see a well-defined consolidation continuing at this juncture.
What Do the Silver Miners Say?
It is sometimes beneficial to monitor the relative trading action in the silver mining sector and compare it to the price of silver bullion itself.
These are two components of the same industry, and we sometimes see divergences which give us hints as to which direction the markets may be moving over the intermediate term.
Image D
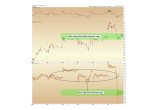
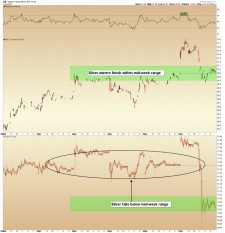
Focusing for a moment specifically on the silver miners, which tend to exaggerate declines in silver lower if they are expecting sustained weakness, we note that the miners largely brushed off the precipitous drop seen on Friday afternoon in silver bullion.
At right we show the SIL silver miners fund on top, and the SLV fund on bottom (silver proxy). Note how the miners closed within the mid-range of the week’s trading, whereas silver bullion closed clearly lower than the week’s trading range. This is the type of divergence we should expect if the miners are not anticipating sustained further weakness in silver bullion.
Silver investors can monitor this relationship to gain some insight as to what may be coming for the metal itself. At least over the short run and after successful silver retest , the mining equities appear to not believe silver will be falling much further.
A return to the prior consolidation zone between initial support ($16.75 - $17.25) and initial resistance ($18.50 - $19.00) would represent healthy basing action from a long-term investment perspective.
The old investment adage goes: “The longer the base, the bigger the move.”
Christopher Aaron,
Bullion Exchanges Market Analyst
Christopher Aaron has been trading in the commodity and financial markets since the early 2000's. He began his career as an intelligence analyst for the Central Intelligence Agency, where he specialized in the creation and interpretation of the pattern of life mapping in Afghanistan and Iraq.
Technical analysis shares many similarities with mapping: both are based on the observations of repeating and imbedded patterns in human nature.
His strategy of blending behavioral and technical analysis has helped him and his clients to identify both long-term market cycles and short-term opportunities for profit.
Share:

