Silver fell by 1.8% or $0.31 cents this week, close at $16.68 and it was the third weekly loss for silver in a row. What should we expect going forward?
We have not had a good look at silver in several months, so let us take the opportunity this week to do so.
First, the stats: for the week ended Friday, silver fell by 1.8% or $0.31 cents, to close at $16.68 as of the final tick for the December futures contract on the New York COMEX. It was the third weekly loss for silver in a row, matching the streak for gold. Silver is down some 8.8% or $1.62 from the recent high of $18.30 in September.
What should we expect going forward? Let us turn to the charts:
Silver Short-Term
Image A
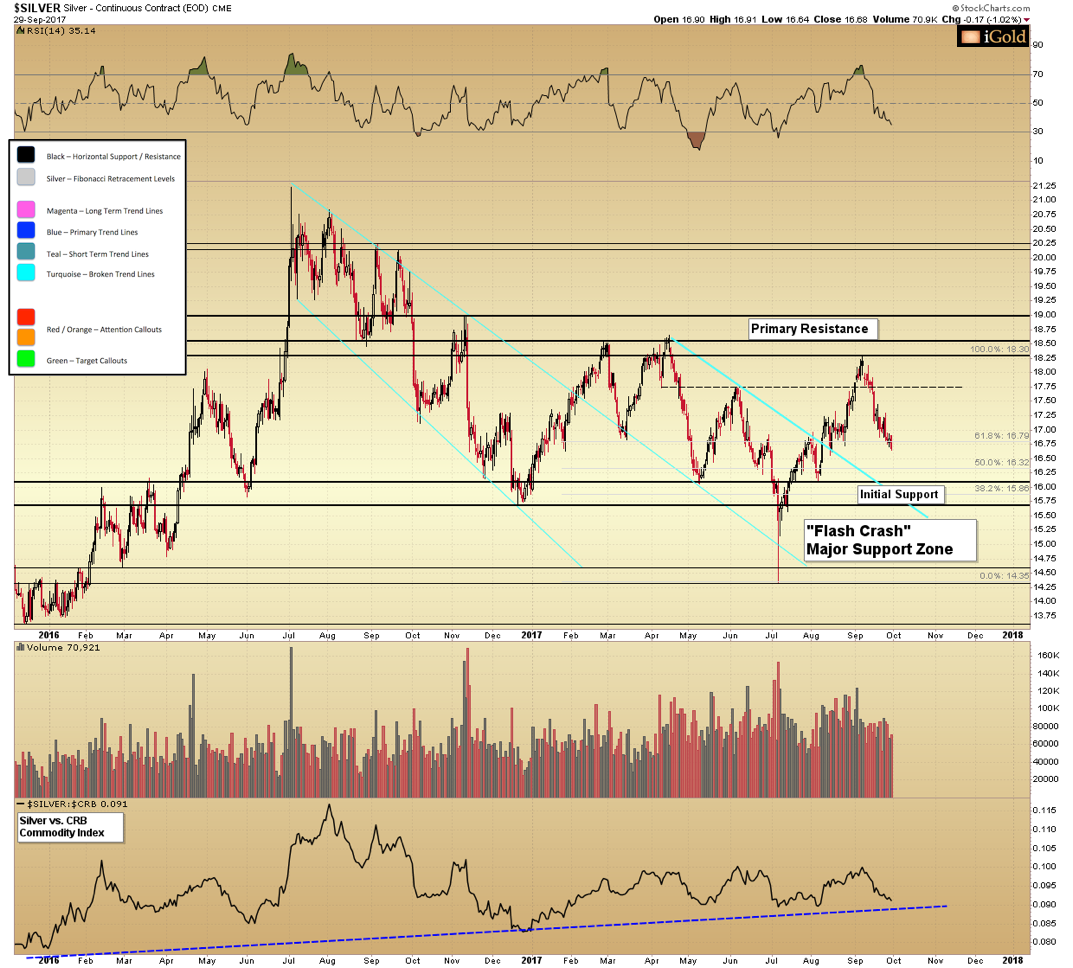
$16.30, at the 50% Fibonacci retracement of the advance starting with the July flash crash lows through the recent peak at $18.30. More important support begins at $16.10 (labeled Initial Support above in black), a level which has held prices higher on five occasions since May 2016. We expect this support zone will hold as gold now retests its long-term downtrend.
As silver moves higher, significant resistance will still be seen in the region between $18.30 - $19.00, an area representing at least five pivot highs since October 2016. All things considered, we expect sellers to emerge in this region again. This is labeled Primary Resistance on the chart above.
Silver Lagging Gold
Silver has been lagging gold since the 2016 peaks for both metals at $21.25 and $1,378, respectively.
In stating this, we are referring to the fact that as of September 2017, gold has come to within 1.2% of its 2016 high at $1,362, while silver has only come to within 14% of its relative 2016 high at $18.30.
Further, in September silver made a lower high at $18.30 than either of its previous 2017 peaks, both of which just touched $18.50. Meanwhile, gold clearly exceeded its 2017 previous high of $1,295 in September.
Referring back to last week’s article, we continue to expect that gold will exceed its 2016 high on the next rally, either late this year or early 2018. However, our model shows that silver will continue to lag, and not exceed 2016 highs at the same juncture as gold.
Should this lagging be a concern for silver investors?
Silver Underperformance in Perspective
A common fallacy in the precious metals world is that silver must “confirm” every move in gold, or else the advance in gold is suspect or doomed to failure. We are not sure where this idea originated from, but it is absolutely false when we study the relative performance of both metals at key junctures throughout history.
Let us consider an example from the past that shares similar technical “basing” characteristics to the current time period for both metals.
2000 – 2004 in Gold and Silver
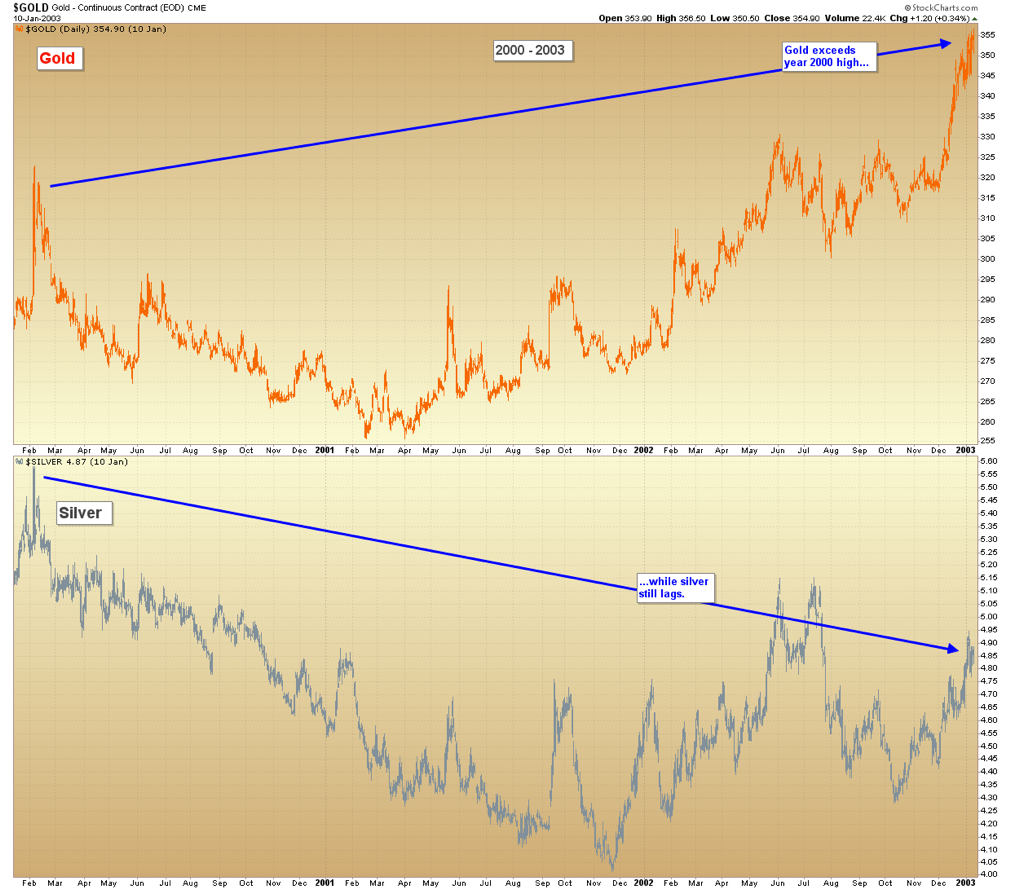
Silver lagged gold notably during the 2000 – 2003 timeframe, as we can observe from the following chart:
Image B
After lengthy bear markets were nearing their terminal stages at the turn of the millennium, notice how gold began to turn upward and finally eclipsed its February 2000 peak at $323 per ounce by December 2002. Meanwhile, silver lagged gold for all of its advance. For example, silver remained well below its related 2000 peak at $5.60 even in December 2002, only reaching $4.85.
Was this underperformance by silver a reason to discount gold’s advance? Or was silver’s lag effect actually an opportunity in disguise for investors who were following the broader market context?
Let us advance the chart above by one additional year:
Image C
Despite lagging for most of the 1999 – 2002 timeframe, silver began to play catch up to gold in early 2003. In fact, silver rose over 90% from the point where our first chart ended in February 2003 through the April 2004 high. During this time, gold advanced only 17%.
Investors should be aware: most of the “work” in silver investing comes during the waiting. Silver can lag gold for weeks, months, or even years.
However, when silver does finally begin to catch up, it often does so rapidly and with little warning. The payoff tends to be worth the wait, even if it is frustrating to those with short time horizons.
Expectations for Silver
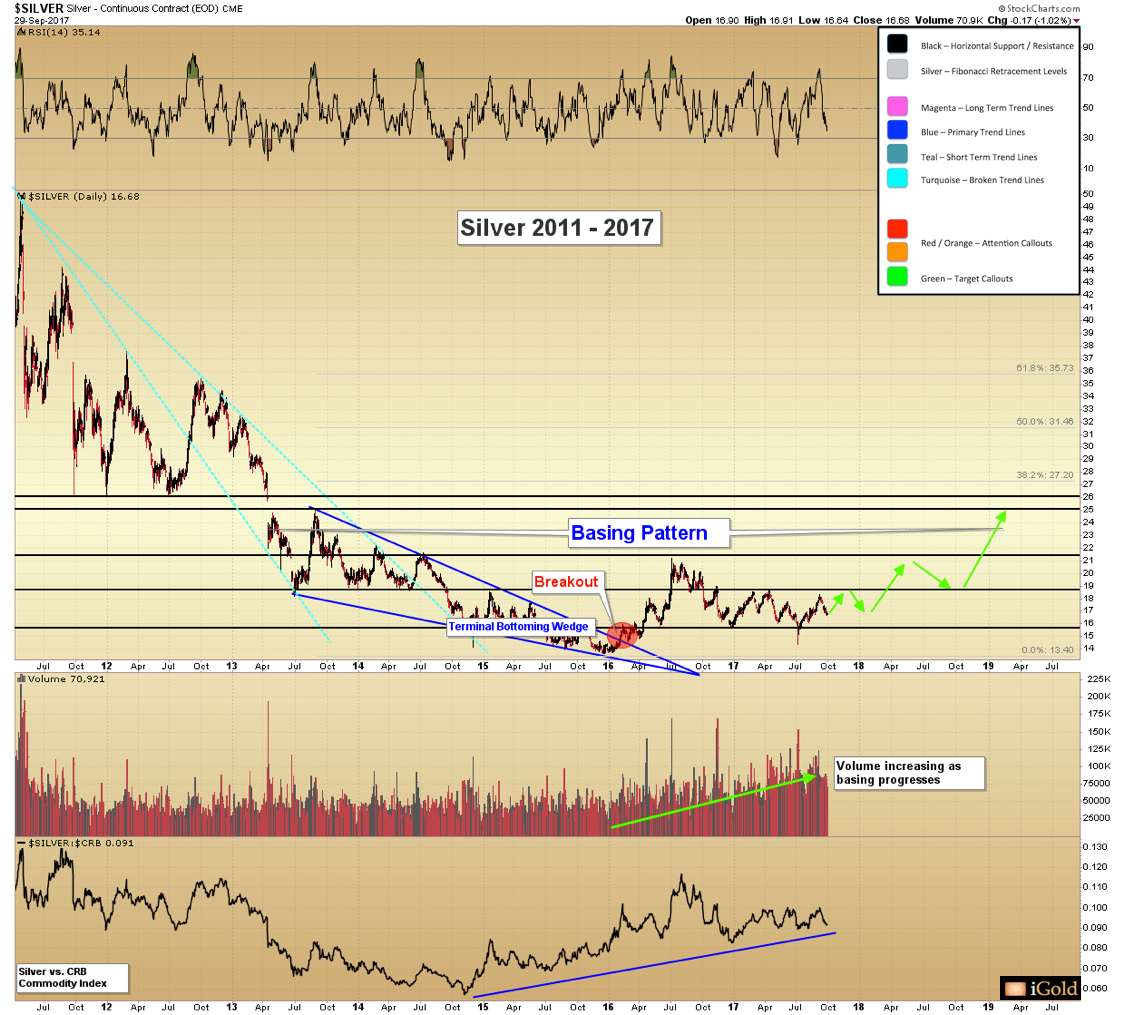
Despite lagging gold recently and our expectation that it may lag for some months further, silver remains in a healthy basing pattern on the long-term chart.
Silver’s long-term base will eventually be seen to be all price action underneath the key $25/oz level. We expect silver will continue to trade from the mid-teens through the low twenties per ounce for the next 12-24 months, even as gold looks to start a more significant advance.
During this basing period, metal will be quietly transferred from weak hands to strong.
Once the basing process completes and silver breaks $25, an entirely new trajectory will begin. But this is likely still 2-3 years into the future.
Image D
Takeaway on Silver
Silver will play catch up to gold when many least expect it. For now, let us not fall into the trap of assuming that silver underperformance means moves in both metals are suspect. History shows that gold leading silver indicates an early-stage of an emerging advance, not a doomed market.
Christopher Aaron,
Bullion Exchanges Market Analyst
Christopher Aaron has been trading in the commodity and financial markets since the early 2000's. He began his career as an intelligence analyst for the Central Intelligence Agency, where he specialized in the creation and interpretation of pattern-of-life mapping in Afghanistan and Iraq.
Technical analysis shares many similarities with mapping: both are based on the observations of repeating and imbedded patterns in human nature.
His strategy of blending behavioral and technical analysis has helped him and his clients to identify both long-term market cycles and short-term opportunities for profit.
This article is provided as a third party analysis and does not necessarily matches views of Bullion Exchanges and should not be considered as financial advice in any way.
Share: