In November, gold price saw its single-highest ever monthly trading volume on the New York COMEX exchange.
There continues to be a major divergence developing within the gold market.
As we saw three weeks ago, investor demand in North America has fallen to near-decade lows. You can see the previous article.
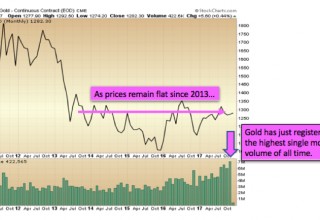
Yet for November just concluded, gold saw its single-highest ever monthly trading volume on the New York COMEX exchange, at over 7.1 million contracts. This, as prices remain in one of the tightest ranges in recent memory, having oscillated by just 3.5% since the beginning of October.
Image A
Yes, we know that the majority of the trading activity which occurs on the COMEX is on paper only. Yet the COMEX is also the primary way in which large institutions will purchase gold in North America. Banks, hedge funds, and commodity funds do not buy individual coins and bars – they generally purchase on the futures market, and then either stand for delivery or roll their contracts over prior to expiration.
Thus, when we observe record-breaking monthly volume on the COMEX exchange, this is a signal we should pay attention to, even as physical-only investors.
It is often said that in technical analysis “volume precedes price”, as insider buying and selling will trigger volume indicators prior to the actual changes in price. Record-breaking volume does not happen without reason. With each buy and sell, metal is being transferred from weak hands to strong hands.
One or more entities are positioning now in the gold market. The only question is: do we have the patience to find out why?
Gold Mining Bifurcation
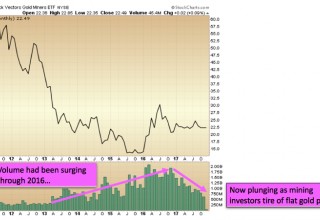
Again, as physical metals investors, it often pays to monitor other sub-sectors of the precious metals to gauge the overall pulse of the market. Interestingly, although we see record monthly volume on the COMEX, we see 2.5-year low volume when looking at exactly the same chart but for the GDX gold miners fund:
Image B
Keep in mind that the last time volume was this low on the GDX, the fund was priced 38% lower than it is today. Gold mining investors, it seems, have largely lost interest in the sector amidst the flat prices of 2017.
How Do We Reconcile This Data?
We continue to suspect that high-powered money from institutions is moving into gold itself, while the mining sector, which tends to attract a greater portion of speculative investors, is seeing apathy at the continued range-bound prices. We also know that a portion of the speculative “anti-dollar” capital that would have otherwise gone into the gold mining sector has instead found an outlet in the recently-hot cryptocurrency market (i.e. Bitcoin).
In sum, we see multi-year low demand volume amongst US coin and bar investors and multi-year low volume within the gold mining sector. Meanwhile, during the very same month, certain entities are purchasing all-time record numbers of contracts each representing 100 ounces of gold on the futures exchange. Some of these entities will indeed stand for delivery.
The only thesis we can arrive at is that “smart money” is positioning now, during the later stages of what is a 5-year basing process for gold prices. Meanwhile, “speculative money” is mostly absent.
Of course, we are not referring to readers of this article in the above categories. The very fact that you have chosen to read about the gold market here during this time of decade-low participation amongst other US investors shows that you seek at least to act with a level of independence from the mainstream.
Still, we cannot ignore these volume numbers, and as a precious metals investor, one could not ask for a better scenario: flat prices overall since 2013… record high volume entering gold on the institutional side… multi-year low volume on the retail side and within the mining sector.
As contrarians with a multi-year time horizon, we are quietly smiling at the setup.
Christopher Aaron,
Bullion Exchanges Market Analyst
Christopher Aaron has been trading in the commodity and financial markets since the early 2000's. He began his career as an intelligence analyst for the Central Intelligence Agency, where he specialized in the creation and interpretation of pattern-of-life mapping in Afghanistan and Iraq.
Technical analysis shares many similarities with mapping: both are based on the observations of repeating and imbedded patterns in human nature.
His strategy of blending behavioral and technical analysis has helped him and his clients to identify both long-term market cycles and short-term opportunities for profit.
This article is provided as a third party analysis and does not necessarily matches views of Bullion Exchanges and should not be considered as financial advice in any way.
Share:


