-
Gold Analysis
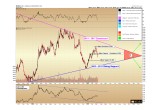
Gold price fell for the second week in a row last week, down $25 or 2.1% from a week prior. The final print on the NY COMEX futures exchange was $1,201 as of Friday afternoon.
Minor support at $1,220 was lost this week, and we expect this area will act as short-term resistance on the next advance.
Further minor support should be seen at $1,180.
Unless you are a short-term trader (for which we encourage utmost caution in the current technical backdrop) we want to draw your attention away from these minor support levels and toward the primary converging pattern which must resolve itself by Q3 – Q4 of this year. That is: the converging of the 2011 – 2017 long-term downtrend (magenta color) and the new rising support line (royal blue) which began in 2015.
Short-term gyrations will take on less and less significance as the two primary trends converge and until one of the trends gives way. When two converging trends meet on a chart, one of them must necessarily break in favor of the other. The outcome typically results in a strong move in the direction of the breakout, as illustrated below by the green arrows.
Based on the trajectory of the trends now developing, this break in one direction or another will occur no later than November, as the trends reach an apex convergence. However, based on past years of observing these patterns, it is generally more likely that the pattern will resolve itself at least 2-3 months prior.
To gauge the likely outcome, we will be watching supporting indicators from silver, the mining sector, the broad commodity complex, and currency cross-pairs over the months ahead.
For the time being, we will be closely monitoring gold price action in the world’s historic store of wealth over the days immediately following this week’s Fed interest rate announcement, due Wednesday afternoon.
Image A
Silver Analysis
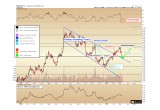
Silver price fell 4.6% or $0.82 cents for the week to close at $16.92 as of the final trade on the New York COMEX on Friday afternoon.
Although the price has fallen below anticipated support near $17.25, the message of this market is of a retest of the broken primary declining (blue) channel. The breakout came five weeks ago (red callout), and it is common for retests of broken declining channels to occur at a lower price point than the original breakout, due to the fact that the channel is necessarily falling.
By falling rapidly for six out of the last seven trading days, silver has approached oversold status on the RSI indicator (top of chart), indicating a short-term bottom (at minimum) is due.
We expect silver will be making a bounce from this channel retest, shown by the green callout, on the way to challenging resistance near $18.50 over the next month.
The downtrend breakout would be considered to have failed – a bearish sign that a deeper low is in store for the future – if prices fall more than $0.30 cents further and definitively re-enter the declining channel.
Image 2
Christopher Aaron,
Bullion Exchanges Market Analyst
Christopher Aaron has been trading in the commodity and financial markets since the early 2000's. He began his career as an intelligence analyst for the Central Intelligence Agency, where he specialized in the creation and interpretation of the pattern of life mapping in Afghanistan and Iraq.
Technical analysis shares many similarities with mapping: both are based on the observations of repeating and imbedded patterns in human nature.
His strategy of blending behavioral and technical analysis has helped him and his clients to identify both long-term market cycles and short-term opportunities for profit.
Share:


