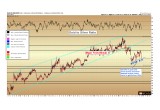
As shown on the chart, the defining characteristic of the decline in gold and silver prices since the July/August highs has been the rising trend in the gold to silver ratio.
Of course, this ratio measures the number of ounces of silver needed to purchase one ounce of gold.
The fall in the gold/silver ratio from above 80 in January to 64 in early July corresponded to the advances in both metals with outperformance by silver. However, the rise in the gold/silver ratio since July from 64 to 68 as both metals have declined has shown only marginal outperformance by gold.
In other words, as a sum, since the beginning of the year, silver has outperformed gold when viewing the entirety of the advance and subsequent retracement.
(See image A)
Silver’s 2016 Outperformance in Perspective
The major gold/silver ratio trend breakdown in April (first red highlight circle) was a defining change in the ongoing pattern, after nearly five years of rising in favor of gold (large turquoise channel).
The initial wave lower in the gold/silver ratio (corresponding with rising metals prices) lasted through September. While this initial wave lower was halted at the end of September, we do not expect the former 2011 – 2016 rising channel to be regained again.
In other words: silver outperformance is likely over a multi-year period ahead, even though it will underperform gold during sometimes lengthy corrections.
Different Strategies for Different Investors
Of course, each precious metals investor comes to the sector with a different set of goals, a different time horizon, and a different tolerance for risk. Whereas long-term investors may find dollar-cost averaging into the lows to be a helpful strategy, those with a shorter-term time horizon may want to focus on following some of these technical indicators along with us.
Those wanting to hold gold as “wealth insurance” in case of political or economic turmoil are reminded that the best time to buy an insurance policy is not when it has gone up in price, but when it has come down. And those insurance policies are now some $200 cheaper per ounce than they were in mid-summer.
Christopher Aaron,
Bullion Exchanges Market Analyst
Christopher Aaron has been trading in the commodity and financial markets since the early 2000's. He began his career as an intelligence analyst for the Central Intelligence Agency, where he specialized in the creation and interpretation of pattern-of- life mapping in Afghanistan and Iraq.
Technical analysis shares many similarities with mapping: both are based on the observations of repeating and imbedded patterns in human nature.
His strategy of blending behavioral and technical analysis has helped him and his clients to identify both long-term market cycles and short-term opportunities for profit.
This article is provided as a third party analysis and does not necessarily matches views of Bullion Exchanges and should not be considered as financial advice in any way.
Share:


