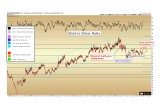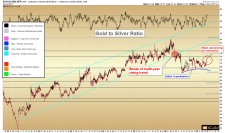
The gold to silver ratio (GSR) has moved toward the upper end of the range.
The gold to silver ratio (GSR), or the number of ounces of silver required to purchase one ounce of gold, has not followed the timeline of the more aggressive move lower we were anticipating over the last several months. Instead, the ongoing consolidation between 65 – 74 on the ratio has moved toward the upper end of the range over the last few weeks, as gold price has remained steady above $1,260 yet silver price has fallen to the low $17 range again.
Recall that a rising GSR tends to correspond with falling gold and silver prices, as was seen from 2011 to late 2015.
The final close on the GSR was 73.4 as of Friday afternoon.
Image A
Still, the most important facet of the above chart is to note that the ratio remains healthfully below the 2011 – 2016 broken rising trend channel (turquoise lines). This breakdown has held for over a year. It would be rare for such a breakdown to reverse and make new highs during the current cycle.
It was the breaking of this clearly-defined trend channel which alerted us to the changing nature of the precious metals market in early 2016. Although the ratio has not moved lower in favor of silver for the last few months, it remains within the confines of an initial consolidation after the multi-year breakdown. Currently the ratio is facing significant resistance at the 74 level.
Silver to Catch Up
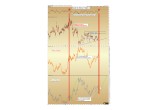
Confirming evidence for silver to play catch up can be seen from a study of the momentum of the ratio’s recent advance, which has reached the highest reading since late February, 2016. The following chart contains the last two years of the GSR, with the momentum indicator (RSI) on top, the GSR immediately below, followed by the price of gold, and then the price of silver, all plotted along the same timescale. Let us examine it closely:
The last time the RSI momentum indicator reached above 70 was in February 2016, when gold had advanced to nearly $1,260, clearly exceeding the previous peak from 2015 at $1,190. Even so, at that moment silver was “stuck” at $14.75, failing to eclipse its relative 2015 peak of $16.25.
We should recall this early-2016 episode carefully. Many analysts at the time asserted that the move in gold was suspect, because silver was not “confirming” gold’s advance each day.
We strongly disagreed at the time, and felt that other technical indicators were confirming a more significant advance to come in both metals. The lag in the move higher for silver was typical of an early-cycle advance in the sector.
What we can see at right is:
The last time the GSR momentum RSI (top of chart) reached 70 this marked the absolute high in the ratio, February 2016.
February 2016 also marked a mid-point consolidation in gold after a strong advance.
Silver lagged gold’s advance, only to play catch-up over the next four months.
The takeaway is that silver does not need to confirm gold’s move across every timeframe. Silver can lag for weeks, months, or even years in certain instances, and this does not negate the validity of gold, nor the eventual catch-up effect that is to be witnessed in silver itself.
Image B
2008 – 2011 Example
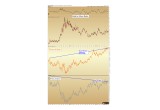
Consider an example from the last precious metals advancing cycle. Gold had peaked in March 2008 at $1,033 per ounce, while silver peaked at the same time at $21.50. After the crash of 2008-2009, gold regained its losses and went on to advance to several new all-time highs into 2010, first above $1,033, then above $1,100, and finally above $1,250.
All the while, silver remained below its 2008 peak of $21.50.
It was certainly frustrating for silver investors over at least a 12-month period.
GSR with prices of gold & silver: 2008 - 2010
Image C
However, was gold’s advance suspect because silver was not confirming it? Or, was this an opportunity to accumulate silver, before the period of catch-up? The following extended version of the above chart will tell:
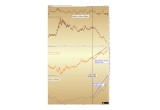
GSR with prices of gold & silver: 2008 - 2011
Image D
Note that the black vertical line shows the ending of the preceding chart. From that point in mid-2010, silver then advanced 180% toward its 2011 peak while gold advanced 25% over the same timeframe.
The major point of this analysis is to be wary of analysts who claim that silver must confirm gold’s moves across every time period. As silver investors, we must be prepared to watch gold lead sometimes for weeks, months, or years. Other technical indicators must be used to determine whether or not we are in a primary advancing cycle in the precious metals. It is not sufficient to simply watch silver lag and label the move suspect.
The present opportunity looks ripe for silver to begin playing catch up over the near-term, even if there are further periods of lag to come as the metals advance through 2018.
Our long-term target is for silver to reach at least 17-1 on the GSR, the level last seen at the 1980 precious metals peak of $850 gold and $50 silver.
Christopher Aaron,
Bullion Exchanges Market Analyst
Christopher Aaron has been trading in the commodity and financial markets since the early 2000's. He began his career as an intelligence analyst for the Central Intelligence Agency, where he specialized in the creation and interpretation of the pattern of life mapping in Afghanistan and Iraq.
Technical analysis shares many similarities with mapping: both are based on the observations of repeating and imbedded patterns in human nature.
His strategy of blending behavioral and technical analysis has helped him and his clients to identify both long-term market cycles and short-term opportunities for profit.
Share:

