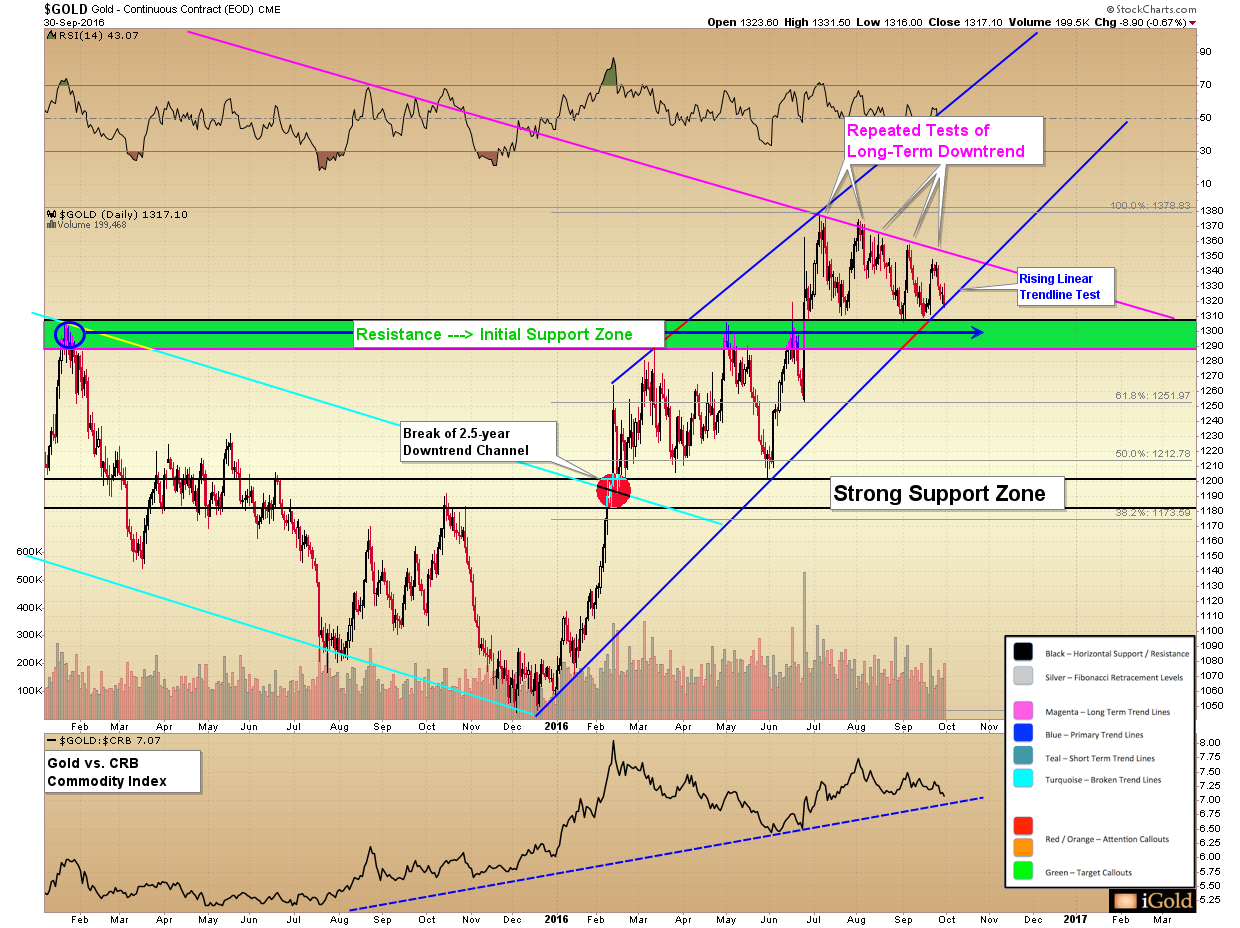
From a technical observation, gold is now directly meeting with its rising linear trendline.
Since the December 2015 bottom in precious metals, gold has risen $272 or 26% from the low of $1,045 per ounce, to close at $1,317 last Friday. From a technical observation, gold is now directly meeting with its rising linear trendline from the absolute lows (shown in blue). This line acted as support to mark the end of the correction in early June. Of course, the line simply represents big buyers who have been showing up in the gold market at increasingly higher levels over the last six months — and we now want to see if they will show up again this week, just above $1,300.
(See image A)
It will be an important test for gold. If the trend channel from the lows is going to hold, it will exert itself within the next 2-3 days, and the price should fail to close below the line for more than one day. This would then set up gold to attempt to break its long-term downtrend (magenta color) by mid-October.
Should the trendline fail — it will constitute a technical breakdown in the short-term, but all hope will not be lost for the intermediate outlook . The support zone in the region of $1,306 — which extends down to $1,285 and is shown in green — has held gold higher on four separate occasions over the last three months, and it is expected to continue to do so should the linear trend no longer remain in tact.
As investors in the volatile metals, we must expect the prices to move in a series of surges, consolidations, and corrections over the course of the next several years.
Nearing the bottom of the most recent trading range, the mood in the precious metals community has turned decidedly negative in the short-run, despite what has been less than a 5% correction in the gold price since late-June. Recent headlines from Bloomberg this week include “Bulls Feeling Frayed as Gold’s First-Half Run Fades Into History” and “Gold-Mining Investors hit by the Hitters as Share Rally Sputters”.
It is said that corrections can manifest either in price or in time — and in this case it is clearly happening in the later. Yet no matter which form they take, both price and time corrections serve to set the stage for the next round of advances as weak hands get flushed out of the market and new investors arrive.
When viewing mainstream articles that focus mostly on sentiment, it is helpful to remember that sentiment must necessarily be worst in the terminal stages of a correction, as quotes and headlines come from those who have already sold. And when a critical majority has sold, this is when a bottom in price is imminent.
Dow / Gold Ratio Update
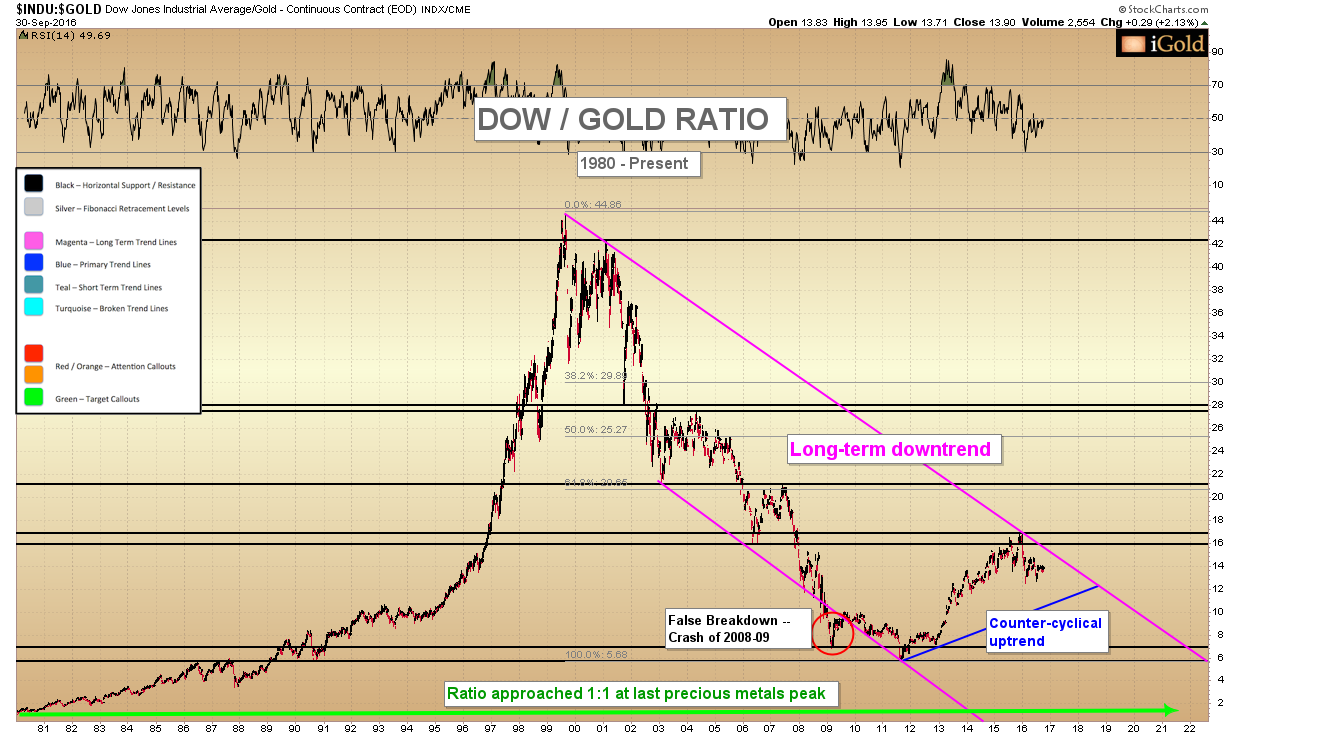
The Dow to Gold ratio provides an excellent way to view the long-term real value potential for gold relative to the broad US stock market.
As discussed in past articles, the ratio has approached a 1:1 reading twice prior in the last century at precious metals peaks: in 1932 when the Dow crashed to the low 40’s and gold was revalued from $20 to $35 per ounce, and again in 1980 when the Dow sat at 850 and gold exceeded $850 per ounce.
We expect that the ratio will hit 1:1 again before this cycle is completed in favor of precious metals.
(See image B)
Updating the analysis, with the Dow at 18,308 as of Friday, September 30 and gold at $1,314 per ounce, the ratio stands at 13.9 : 1. The 1:1 target could thus occur with stocks staying flat and gold approaching $18,000 per ounce, or the Dow falling to 2,500 and gold rising to meet it at $2,500 per ounce. Either way, the result should be over a 90% loss in value in real terms for US stocks before the next precious metals peak occurs.
Although such gains for gold or drops in the Dow may seem extreme given current prices, imagine that the same must have been felt with gold at $35 per ounce and the Dow at 900 in 1968. Yet the two did meet 12 years later.
Presently, the Dow / Gold ratio is in the later stages of a counter-cyclical uptrend, shown by the blue line above, amidst the generational downtrend shown in magenta.
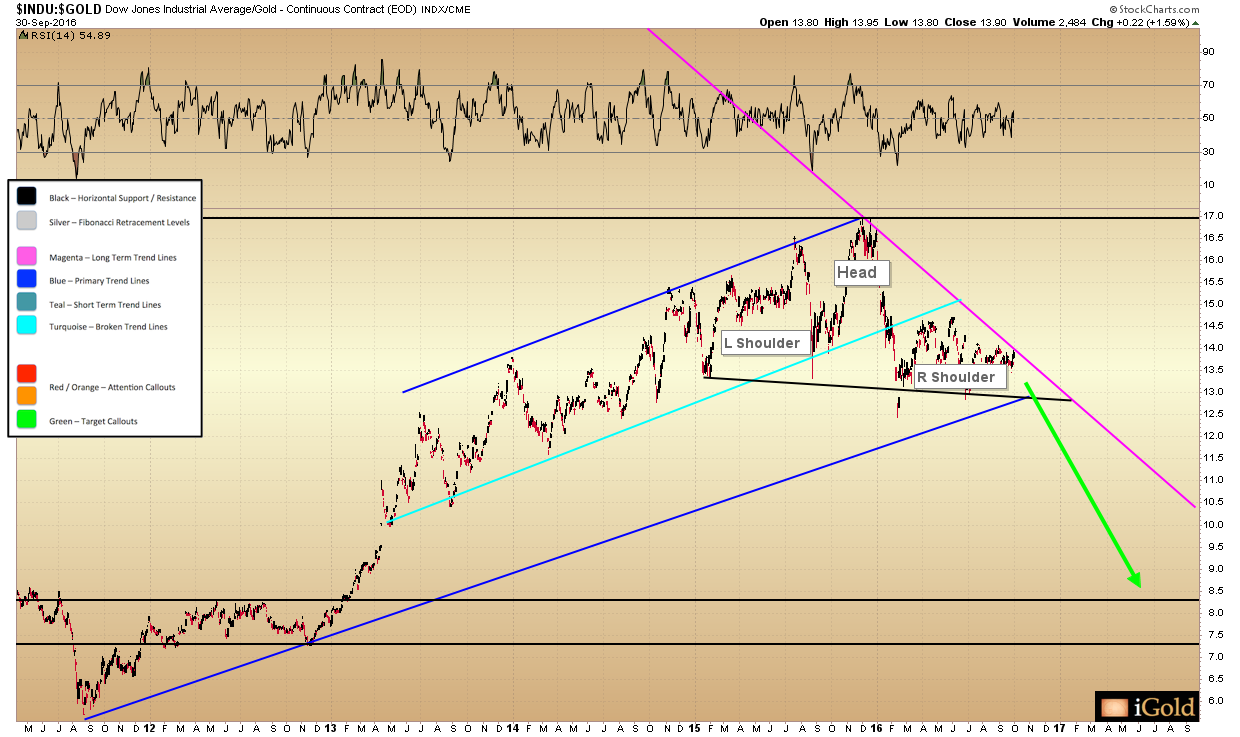
Zooming in above on the counter-cyclical uptrend in favor of stocks since 2011, we see that the advance in the ratio has been halted by the declining long-term downtrend, and is now forming an ugly topping pattern, seen as a bearish-slanted head & shoulders formation in the Dow / Gold Ratio:
(See image D)
Once the support of the right shoulder is breached, the intermediate downward target for the pattern is measured at 9.0 on the Dow / Gold ratio, which should correspond to either the loss in value in stocks or the surge in price in gold — both of which will cause increased attention toward precious metals amongst mainstream investors.
Christopher Aaron,
Bullion Exchanges Market Analyst
Christopher Aaron has been trading in the commodity and financial markets since the early 2000’s. He began his career as an intelligence analyst for the Central Intelligence Agency, where he specialized in the creation and interpretation of pattern-of- life mapping in Afghanistan and Iraq.
Technical analysis shares many similarities with mapping: both are based on the observations of repeating and imbedded patterns in human nature.
His strategy of blending behavioral and technical analysis has helped him and his clients to identify both long-term market cycles and short-term opportunities for profit.
This article is provided as a third party analysis and does not necessarily matches views of Bullion Exchanges and should not be considered as financial advice in any way.
Share: