Here is the technical perspective for gold for the short and intermediate timeframes, which shows that gold volatility begins lessening.
Last week we noted that silver had broken its year-long support zone between $15.75 - $16.15 during the prior week’s flash crash. What does this apparent breakdown mean for gold? Let us update the technical perspective for gold for the short and intermediate timeframes:
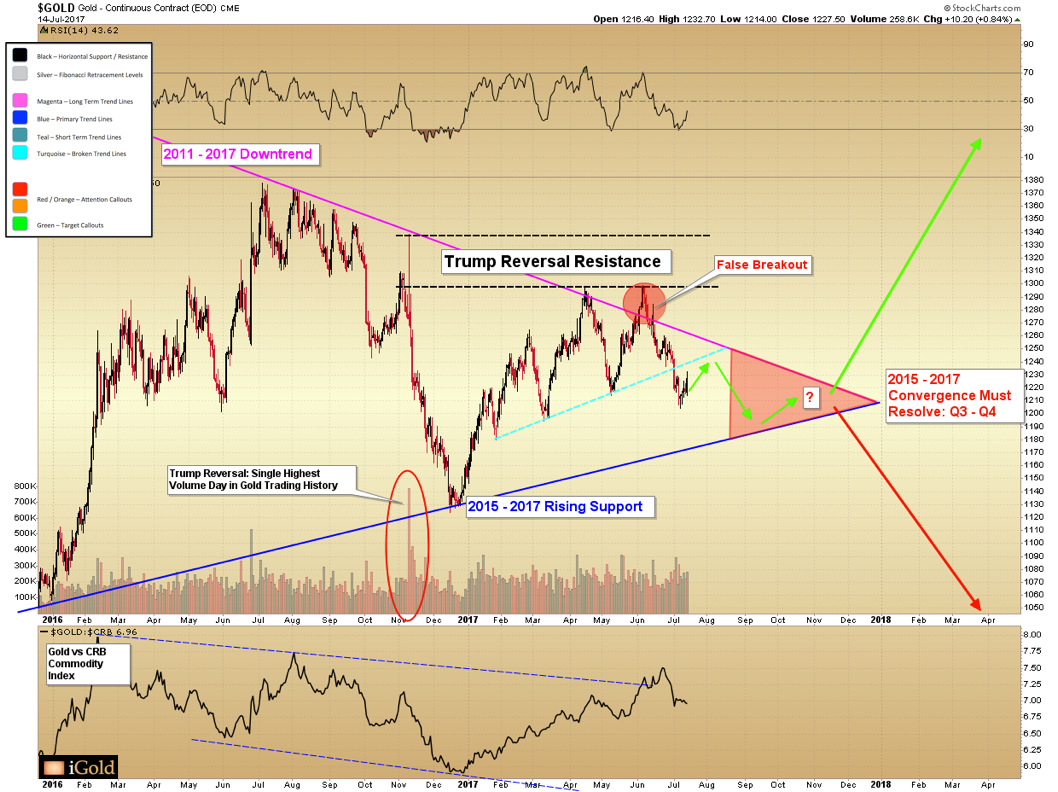
Image A
For the week as a sum, gold rose 1.5% or $18 to close at $1,227 as of the final trade in New York on Friday afternoon.
Two weeks ago, gold broke short-term rising support at $1,232 (turquoise line, above). This trendline was rising, and we must recall that retests of rising trendlines can indeed occur at a different (in this case higher) price level than the original breakdown point.
Thus, our best assessment is that gold is set to move moderately higher for the remainder of July and into August below its broken short-term support. This means that gold should continue moderately higher for the next 4-6 weeks below $1,250.
We expect gold will not regain its broken (turquoise color) trendline yet, and so the precious metal should then begin to turn lower again by late August, toward a test of its lower (blue) boundary of the pennant consolidation. This level now comes in at $1,175 and is rising by the day.
On a Gold Recapture of Broken Trendline
If gold were to negate its recent breakdown and recapture $1,250, the convergence of this short-term (turquoise) trend and the long-term (magenta color) 2011-2017 downtrend would occur at nearly the same price level by late-August: $1,250. So, it would be one of the clearest technical signals we could ask for to indicate a new strong rising trend had begun, as both a breakout from a short-term and long-term resistance level simultaneously.
Officially, there are 5.5 months left before the giant pennant-shaped consolidation shown above must resolve in one direction or another. This would be quite literally at the end of the calendar year in December, visible at the far right of the chart above.
However, in the vast majority of historic examples, these patterns will resolve several months before the actual apex occurs. The August – October timeframe is our best estimation, as for confirmation to whether we will have a legitimate bull market on our hands or the beginning of a decline to new lows perhaps below the 2015 bottoms. There will be opportunities to profit and/or protect ourselves in either scenario, but we must get the primary direction correct first.
For now, short-term traders are cautioned that whiplash is likely, as gold is officially “trendless” – having broken both its short-term downtrend since June and its intermediate rising trend from January lows – all within the confines of the much larger consolidation.
Expect volatility to begin lessening and for gold to appear almost comatose during the last several weeks immediately prior to either a breakdown or breakout in the August – October timeframe.
Investment Considerations
How one chooses to position prior to the resolution of gold’s giant consolidation pattern is largely a factor of personal goals, time horizons, and risk tolerance.
For example, an investor on a long-term accumulation plan, who is investing 10% - 20% of his/her assets into gold as either long-term savings or a “wealth insurance” policy, would likely welcome a period of lower prices should they manifest. After all, buying an asset for lower prices over the short-run can lead to a lower dollar-cost average price for the long-term holding.
However, those with a shorter-term time horizon might choose to pay closer attention to the resolution of the chart pattern shown above. If the pattern resolves higher, gold is calculated to see a surge of $200 - $300 within the following 12 months. However, if the pattern resolves lower, an equally large decline is what the target calls for. These might sound like two extreme scenarios – yet these are exactly the types of moves that are predicted from the resolution of converging consolidation patterns.
We are now in the terminal last months of gold’s consolidation. Readers should not assume that gold will remain so quiet going forward as it has over the past year. Please stay tuned as we zero in on leading indicators over the next few months which should help us gain insight into gold’s coming resolution in one direction or the other.
Christopher Aaron,
Bullion Exchanges Market Analyst
Christopher Aaron has been trading in the commodity and financial markets since the early 2000's. He began his career as an intelligence analyst for the Central Intelligence Agency, where he specialized in the creation and interpretation of pattern-of-life mapping in Afghanistan and Iraq.
Technical analysis shares many similarities with mapping: both are based on the observations of repeating and imbedded patterns in human nature.
His strategy of blending behavioral and technical analysis has helped him and his clients to identify both long-term market cycles and short-term opportunities for profit.
This article is provided as a third party analysis and does not necessarily matches views of Bullion Exchanges and should not be considered as financial advice in any way.
Share: