For the week, gold rose $21 or 1.7% to close at $1,279 as of the last trade on the New York COMEX on Friday afternoon. Let's take a look.
For the week, gold rose $21 or 1.7% to close at $1,279 as of the last trade on the New York COMEX on Friday afternoon. Let us take long, intermediate, and short-term views of gold, for a full look at where the precious metal stands from a technical backdrop.
Gold Long-Term
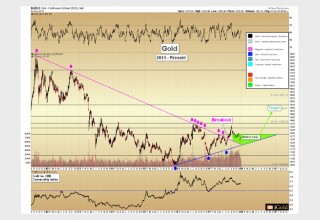
Gold remains healthy from the standpoint of the long-term downtrend retest that has been ongoing since September. Shown below is the multi-year perspective, since the 2011 high of $1,923 per ounce. Note the clear linear downtrend which formed from the successive lower peaks through mid-2017. This trendline was broken in August of this year, and the process of returning back into the (green) shaded retest zone consists of a period of time in which the market tests new buyers to see if they are as resolute in the establishment of a new trend as they appeared to be several months ago.
Image A
Gold Intermediate-Term
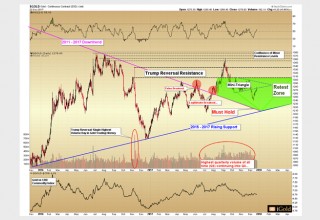
Let us now update the intermediate-term view for gold. Below is the two-year chart. A double-bottom or/or nominal new lows would still fit within the technical model of the retest, but the preponderance of evidence suggests that the low has been finalized.
Image B
We have seen strong rebounds in the mining sector over the past week, a signal typical of sustainable advances in the metal itself. This occurred with a December low coinciding with the Fed rate hike from two weeks prior. When we combine these factors with the potential for a decline in both the US dollar and US bonds in the near future as discussed in recent articles, this leads us to favor the odds that the low for gold’s retest is in.
Gold Short-Term
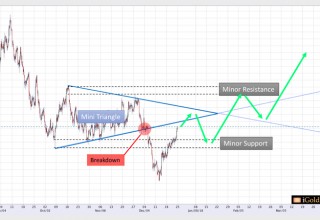
We refer below to the following short-term chart, taken from our trading desk, which features intra-day gold price movements since just the September peak:
Image C
- A mini triangle consolidation (blue) was broken lower in early December. This gave a target of $1,240 for gold, which was hit on December 13.
- After a breakdown of a triangle, initial resistance should exist near the apex of the broken formation. In this case, we expect to see resistance come in near $1,285 +/- $5 dollars on this recovery. Fundamentally, this occurs as traders who bought futures contracts within the consolidation sell at break-even.
- Gold should then retreat, to find support in the region labeled Minor Support (black), during the first 1-3 weeks of 2018. This region represents horizontal support forming the lower boundary of the triangle. Support should thus be seen between $1,260 - $1,265 on any retracement.
- If gold fails to hold $1,260 - $1,265 on any retracement, it increases the odds of one final low to come below December’s bottom of $1,236.
- Assuming Minor Support holds, we look for the next surge in late January to take gold above the apex of the triangle and toward Minor Resistance, labeled in black, between $1,300 - $1,305. This represents a confluence of swing highs forming the upper regions of the triangle.
- Gold should retreat again from Minor Resistance, back down into the vicinity of the broken upper (blue) boundary of the triangle, likely to $1,275 - $1,280.
- The final advance of this sequence will break Minor Resistance and see gold make a third functional test of 2016 highs, in the $1,350 - $1,378 zone. This appears likely for Q2, 2018. We will analyze the strength of gold’s advance at that time for probabilities of timing for new highs.
Takeaway on Gold
Gold appears to have formed a critical bottom, from which a new primary rising trend will last at minimum 12-18 months.
$1,260 should hold as support for any weakness. A break of $1,260 means a nominal new low may still be required as part of the long-term downtrend retest. Under no circumstances should $1,205 fail in this model.
A series of minor waves corresponding to short-term support/resistance will characterize gold’s movements for the first several months of 2018. These may appear as random price movements to the casual observer but should correspond closely with the above-labeled zones.
Once $1,305 is exceeded on a weekly closing basis, gold should rapidly challenge 2016 highs for a third time, the breaking of which will result in a new primary advancing trend to last into the $1,500 range at minimum.
Christopher Aaron,
Bullion Exchanges Market Analyst
Christopher Aaron has been trading in the commodity and financial markets since the early 2000's. He began his career as an intelligence analyst for the Central Intelligence Agency, where he specialized in the creation and interpretation of pattern-of-life mapping in Afghanistan and Iraq.
Technical analysis shares many similarities with mapping: both are based on the observations of repeating and imbedded patterns in human nature.
His strategy of blending behavioral and technical analysis has helped him and his clients to identify both long-term market cycles and short-term opportunities for profit.
This article is provided as a third party analysis and does not necessarily matches views of Bullion Exchanges and should not be considered as financial advice in any way.
Share:


