Based on the recent analysis, we can conclude that gold itself still has further room to run over the intermediate timeframe.
There are several unique signals showing us that – barring minor intra-week corrections that could occur at any time – gold is set to move higher toward the $1,300 region before any more significant retracement may be due.
To arrive at this target, we examine both the relative strength of the gold mining complex and also the price action in silver. Based on analysis of these related but separate markets, we can conclude that gold itself still has further room to run over the intermediate time frame.
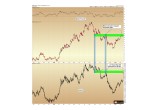
Let us begin by examining the relative strength of the gold-mining sector versus the price action of gold bullion itself. Below we show the GDX large-cap gold mining fund on top with the price of gold immediately below it – stripped of all our typical annotations for a direct examination of relative performance.
Image A
The top green band shows that the gold miners are now back to a resistance level between 25-26 on the GDX fund, which was previously reached both last August and immediately following the Trump-victory in November.
The two vertical grey bands correspond to these points in August and November. By following the bands downward, we can observe what the price of gold was the last time the mining sector was valued near 25-26 on the GDX fund.
The last two times the GDX traded between 25-26, gold averaged $1,305 per ounce.
The gold mining complex is intrinsically related to the price of the metal itself, as the sector’s profits are derived largely from spot bullion prices.
Closing the week at $1,238 as of the last trade on the New York COMEX on Friday, the mining sector is already pricing in nearly a $67 per ounce increase in spot gold.
To further the case for the $1,300 gold target, we turn next to the latest action in silver.
Silver Analysis
As of Friday, we note that gold’s cousin rose for the 8th week in a row last week, rising 0.5% or $0.10 cents to finish at $18.03 as of the final bid in New York.
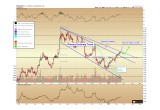
We maintain a target of $18.75 for silver, based on the amplitude ($1.50) of the bottoming pattern observed prior to the breakout above $17.25 in late-January.
It would be rare for silver to achieve a higher target without gold moving higher as well, and so the silver analysis that follows has direct implications for the $1,300 gold target referenced above.
Image B
On Trend lines
There is an important point that traders may wish to note on the silver chart. Our typical analysis is based on best-fit trend lines, to use the term from statistical analysis. However, as the highs composing the upper trend line do not fit perfectly (no trend lines ever will), and as we are anticipating a breakout with some volatility along the way, it would also be wise to identify an absolute-highs trend line.
Such is indicated above on the silver chart by the lighter dashed blue line. Using an absolute-highs trend line, the declining primary trend would come in closer to $18.20.
Which line is more relevant toward the breaking of silver’s downtrend and the establishment of a new period of rising prices?
Generally, the breaking of a best-fit line is most critical.
However, the absolute-highs line is important to keep in mind solely for the reason that some traders will be focusing on it. We should expect some traders to treat it as the defining trend line for the primary decline which began in July 2016. As such, some short-term selling pressure should be seen there.
In due time, those sellers at $18.20 should be taken out during the upcoming advance toward $18.75 if our technical targets are to be met. From that point onward, we will have to re-assess the silver’s short-term setup.
Silver is Leading Gold
Having broken through the best-fit trend line of the primary declining channel (royal blue), silver now finds itself directly challenging the absolute highs trend line. While grinding price action lasting up to 2 weeks could be expected underneath the absolute highs trend line, prices should be well-supported by the $17.25 support level (black line).
We expect that the absolute highs trend line will be broken within the next two weeks, and when it does, the advance toward the $18.75 target will be quick, needing only 3-5 trading days to reach this level.
Please keep in mind that silver, being an extremely small market at only $20 billion in annual physical sales, is prone to overshoot technical targets – both to the upside and to the downside. Should silver exceed $18.75 on this move, a surge to $19.75 is not out of the question as an overshoot by mid-April.
Once we observe the price action around the next high, we will begin to gauge the potential for an intermediate retracement.
The price action of both metals is set to get increasingly volatile through 2017, but as the investment adage goes: “with volatility comes opportunity”.
Christopher Aaron,
Bullion Exchanges Market Analyst
Christopher Aaron has been trading in the commodity and financial markets since the early 2000's. He began his career as an intelligence analyst for the Central Intelligence Agency, where he specialized in the creation and interpretation of the pattern of life mapping in Afghanistan and Iraq.
Technical analysis shares many similarities with mapping: both are based on the observations of repeating and imbedded patterns in human nature.
His strategy of blending behavioral and technical analysis has helped him and his clients to identify both long-term market cycles and short-term opportunities for profit.
Share:


