With no change announced to interest rate policy at the Federal Reserve meeting this week, the markets instead focused mostly on the upcoming US election.
Polls continued to show the gap between Republican Donald Trump and Democrat Hillary Clinton narrowing, now to 1.6%. The correlation between gold and Trump's poll odds has been striking over the last two weeks... and one way or another, the question as to who will lead the United States for the next four years will be decided this Tuesday.
Gold
In sum, gold rose this week by $27 to close at $1,304, a gain of 2.2% from a week prior.
As emotions can become extreme at such critical fundamental crossroads, we find it useful to return our attention at these moments to the charts for what is always the primary driver for the entire precious metals complex: the price of gold.
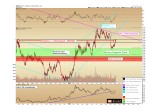
(See image A)
The language of the charts shows us that gold is now directly hitting up against the upper boundary of the broken support zone which held it higher from June through early October, at $1,305.
It would be rare for a market to break down from such a support zone (as happened in October) and then recover it on the first attempt higher, so we would expect to see gold back off in this region, and spend more weeks consolidating between the support established in at $1,245 and the recent high of $1,305. This would then set gold up to make a second attempt to break $1,305 later this year or early 2017. This is what markets "should" do from a technical perspective.
However, a Trump victory would certainly be one of those fundamental triggers that could cause a major breakout on the chart pattern prior to our typical expectation.
For now, we will have to step back and watch the outcome this week. The trading on Tuesday should be fascinating to observe. Whether it is sooner or later, the support and resistance zones that will define the next stages of gold's trajectory are clearly defined, and the most important question we continue to monitor is: "When will gold break its long-term downtrend?"
That break is going to coincide with a fundamental spark that will reveal itself just at the right time. Again, the charts can give us great insight into "what" is happening... the "why" always remains to be seen.
Silver
Silver finished higher for the week by $0.58 cents to close at $18.37, a gain of 3.2%, although well off the high of $18.75 hit on Wednesday.
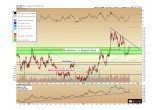
(See image B)
As we can see above, silver got stopped in its tracks just above $18.50, the former support seen in late August. From a technical perspective over the short term, $18.50 matches very closely with the $1,305 resistance in gold. A break and sustained close of either of these levels by either metal would give us a strong indication of a breakout to come in the other.
Strong support for silver price exists between $17.00 and $17.40.
The critical test for silver is that we observe when it breaks the downtrend shown above in blue. We continue to believe silver will break this trend line within the same timeframe as gold's break of its long-term downtrend (magenta color, page 1).
A Note on the Fed Statement
As referenced above, the Fed meeting was generally a non-event this week. However, the language used by the Fed in the non-decision strongly hinted that a second rate hike is due to come, perhaps as early as December:
"Against this backdrop, the Committee decided to maintain the target range for the federal funds rate at 1/4 to 1/2 percent. The Committee judges that the case for an increase in the federal funds rate has continued to strengthen but decided, for the time being, to wait for some further evidence of continued progress toward its objectives. The stance of monetary policy remains accommodative, thereby supporting further improvement in labor market conditions and a return to 2 percent inflation."
This point bears repeating, as the misinformation from the mainstream media is constant and is repeated in almost every major Fed interest rate article: throughout history rising interest rates have corresponded with rising gold prices, not the opposite, as the mainstream press often states.
What we are now witnessing is the very beginning of the slowest rate-hike cycle the Fed has ever engaged in.
Typically over the last 70 years during rate hike cycles, the Fed would raise 0.25% every meeting over the course of 3-5 years. Such was the case, for example, from 2003-2007 as the Fed raised rates from 1% to 5.25% in 0.25% increments, every 6-12 weeks.
Yet during the current cycle, the Fed has raised rates only once, and it has now paused for a full year since that singular rate hike in December 2015. This is the only time in history the Fed has raised rates once, and then paused for the next year. We are witnessing a slow-motion collision course between unsustainable debt levels that cannot afford higher interest rates, and a wave of inflation that is already working its way into various segments of the economy.
Newton's Third Law says: "For every action there is an opposite and equal reaction." The unprecedented interest rate policy we are living through is going to have unprecedented consequences, it is only a question of timing.
Christopher Aaron,
Bullion Exchanges Market Analyst
Christopher Aaron has been trading in the commodity and financial markets since the early 2000's. He began his career as an intelligence analyst for the Central Intelligence Agency, where he specialized in the creation and interpretation of pattern-of- life mapping in Afghanistan and Iraq.
Technical analysis shares many similarities with mapping: both are based on the observations of repeating and imbedded patterns in human nature.
His strategy of blending behavioral and technical analysis has helped him and his clients to identify both long-term market cycles and short-term opportunities for profit.
This article is provided as a third party analysis and does not necessarily matches views of Bullion Exchanges and should not be considered as financial advice in any way.
Share:


