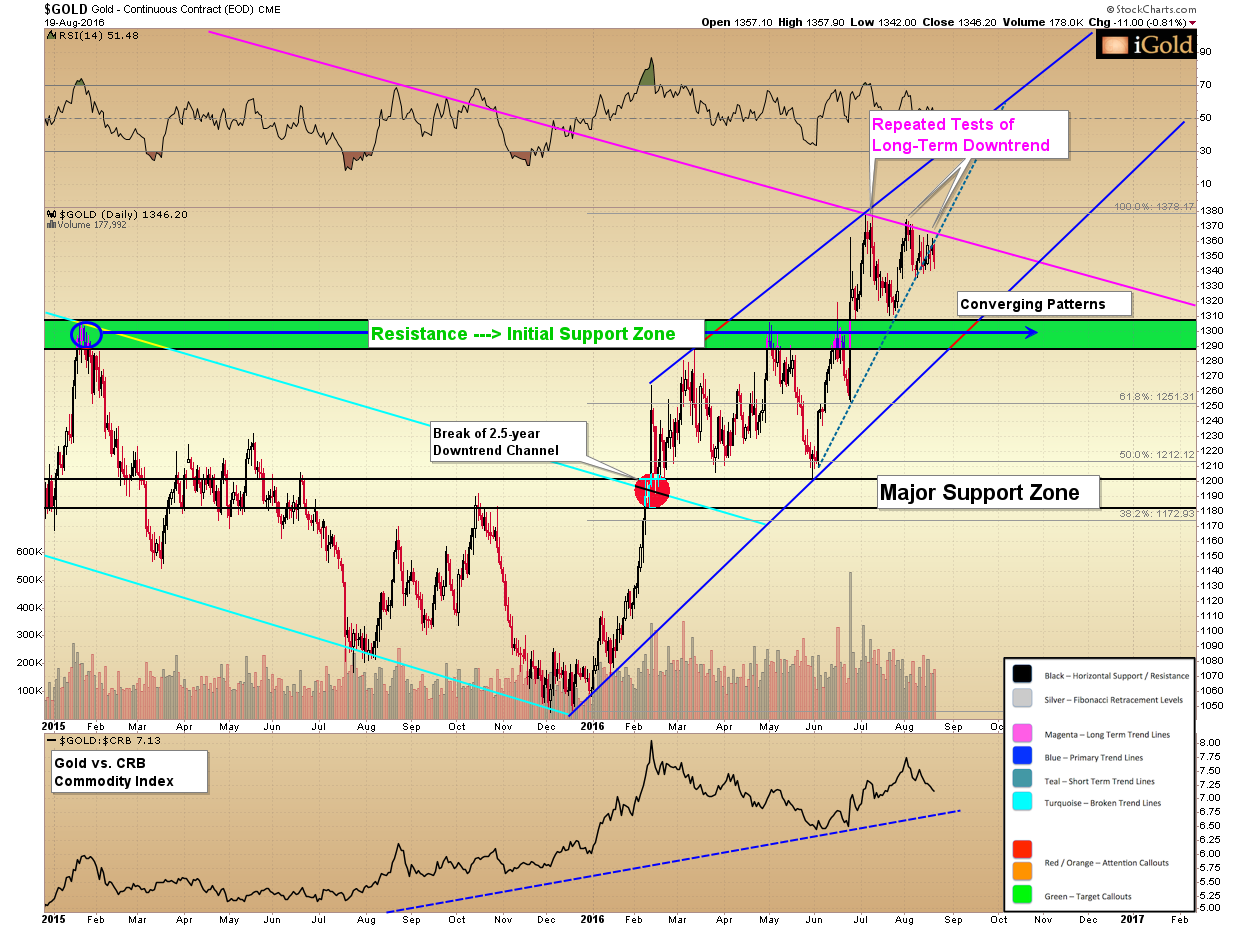
In technical analysis we place a greater emphasis on long-term trendlines for good reason.
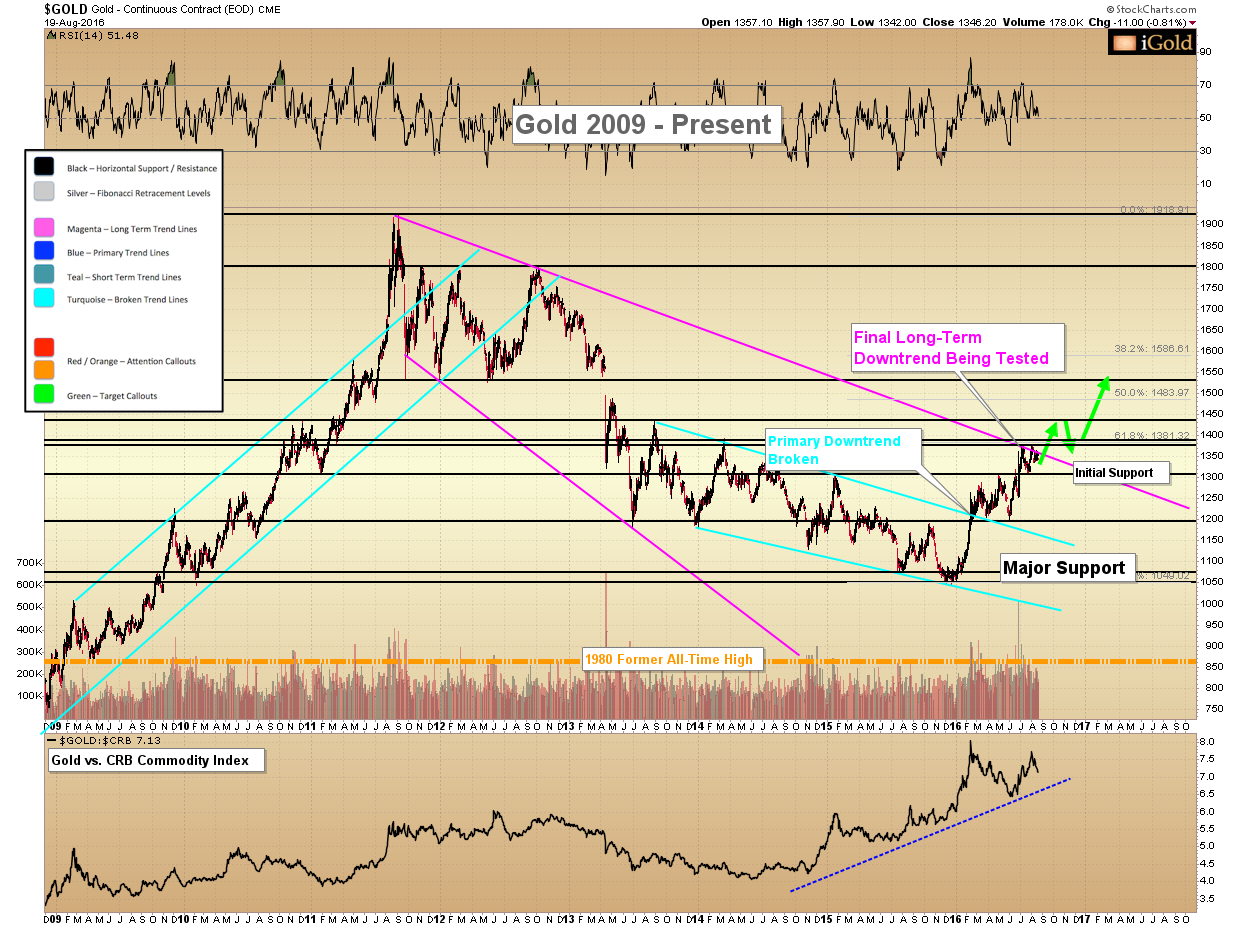
For over seven weeks now gold has continued to bump against its final 2011-2016 downtrend, which has held prices lower since the 2011 high of $1,923 per ounce. Every time it attempts to break higher above this down-sloping resistance level, sellers immediately show up to drive the price back down.
(See image A)
There is clearly a battle going on at this exact moment between bulls and bears. Bears know that if this long-term technical resistance level is broken, it will send a signal to the many investors waiting on the sidelines that the time has arrived to jump back into precious metals market. And when an influx of new technical buyers all enter at once — a surge in price is going to result. The bears are therefore defending this exact technical level we are monitoring. The tightness of the battle is now evident down to the intraday level, where we have observed sellers appearing above $1,355 per ounce and buyers appearing in the $1,330 region over the last week.
(See image B)
What the tightness of this consolidation means is that the market is nearing a resolution. Typically the break of a significant long-term trend line in gold will result in a quick $50 – $100 movement in price. Following that initial break, a retracement toward the trend line will generally occur. The degree to which gold fully or only partially comes back to retest its broken trend line will give us clues as to the strength of the subsequent advance.
Of course, let us not get ahead of ourselves: the technical breakout has not yet occurred. For the week, gold finished higher marginally by $3.00 to close at $1,346.20, for a modest 0.2% gain from a week prior.
Seasonal Indian Demand Ahead
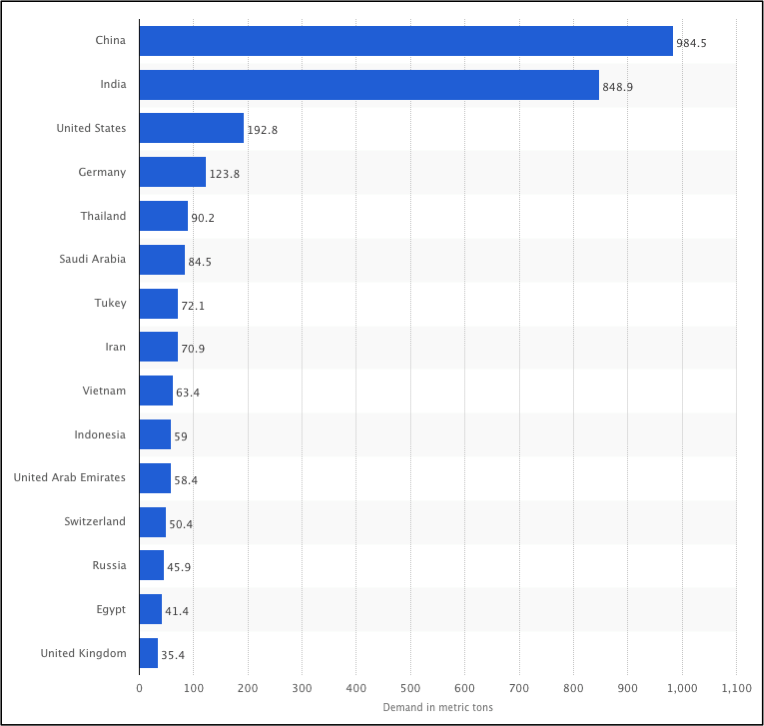
Despite the continued consolidation, sellers will have to be quite determined if they are to continue holding back the price of gold once demand begins to emerge within the next month from India. It is during this late August through September period when increased physical demand is seen year after year prior to the Indian wedding season, which begins in October.
(See image C)
Let us not overlook: Indian demand is critically significant in the physical market. As shown above, India consumes more gold per year than any other country outside China, and more than the United States and Europe combined. And the majority of this demand occurs in the period prior to the October wedding season.
As precious metals investors, we are thus biding our time in waiting mode to monitor the strength of the coming seasonal demand.
Silver Update
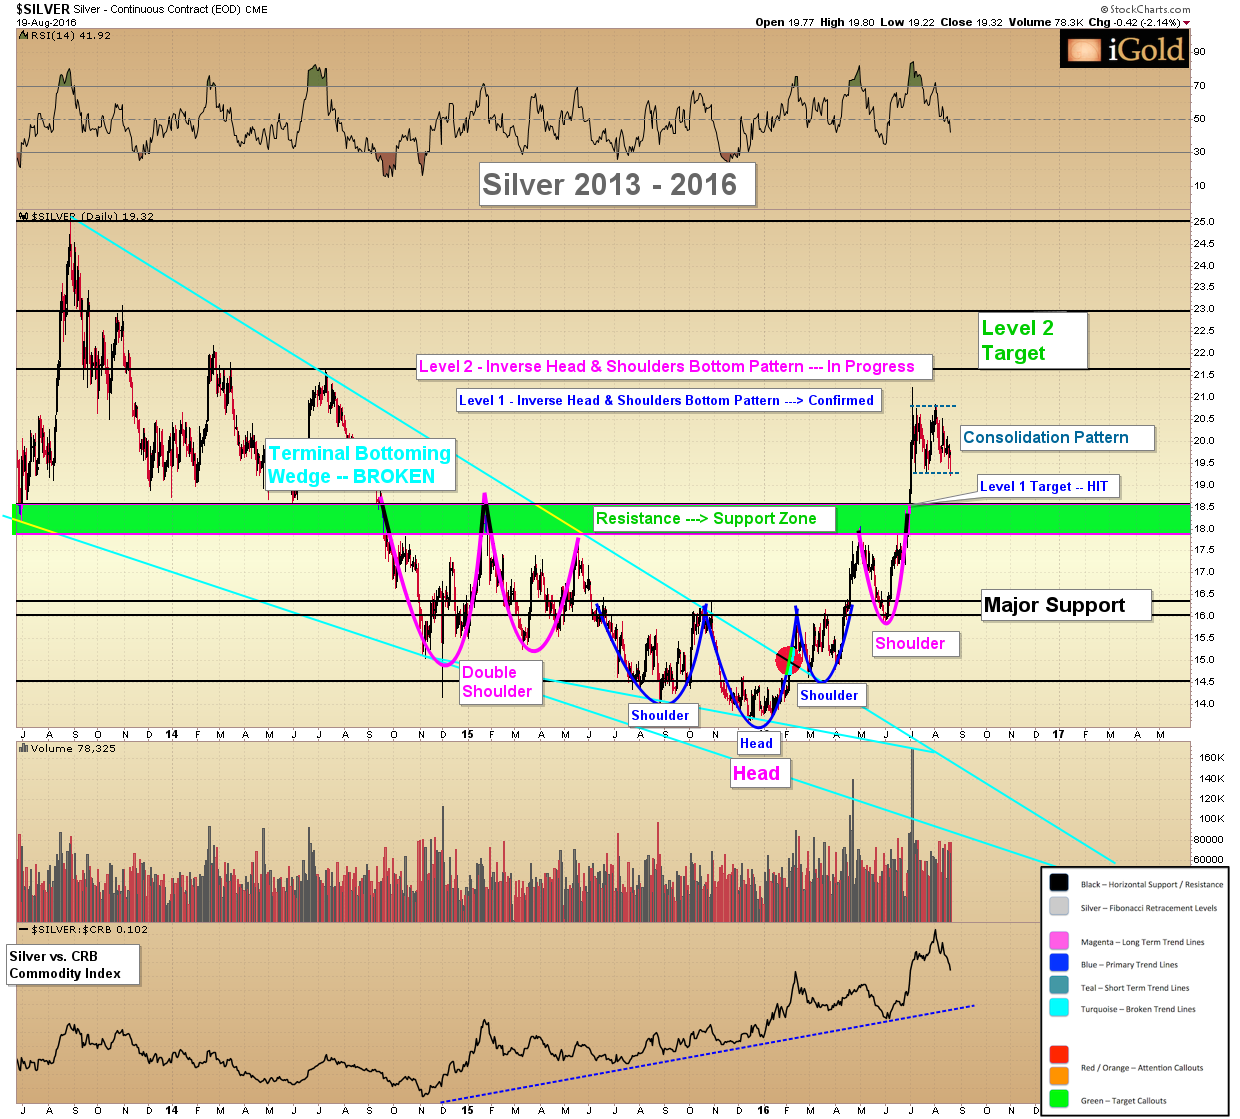
Silver is currently within a midpoint consolidation pattern, with well-defined resistance appearing on the chartsbetween $20.60 – $20.70. Minor support has appeared over the last seven weeks near $19.20; however, stronger long-term support appears between the $17.50 – $18.50 price zone.
Silver’s consolidation is part of a series of imbedded patterns which have appeared since the bottom was confirmed in December 2015 at $13.65 per ounce.
(See image D)
Silver’s actual bottom took the shape of a bottoming wedge formation, shown in the chart above in turquoise color, indicating broken trend lines. The bottoming wedge is a pattern in which both highs and lows are falling, yet highs are falling at a steeper rate than the subsequent lows. This pattern indicates that buyers are stepping in at relatively higher levels on each decline. The pattern tends to represent a terminal bottom formation, in which buyers eventually overcome sellers and a trend reversal is seen. Silver broke out of the formation in February 2016 and confirmed the December bottom, shown by the red highlight circle above.
Remember that these formations merely show us the levels at which large buyers and sellers are entering the market, and the patterns which are defining their behavior. If we study the behavior of large investors and align ourselves with them, we stand to time our entry and exit points better and to potentially achieve a greater profit.
Since the bottom, silver has formed a series of imbedded head and shoulder patterns, the first level of which took place below $16.00, shown in royal blue above.
After breaking higher from $16.00 in April, this pattern targeted $18.25, which was hit in June.
Since achieving its level 1 target, silver now finds itself in the midst of a second-level head and shoulders pattern, which is shown above in the magenta color. The price target for this pattern is between $21.50 – $23.00, and this target is yet to be achieved. $21.50 – $23.00 thus remains our open target for silver’s next advance.
Note that silver has a tendency to overshoot technical patterns, as it is a small market and is prone to extreme swings in either direction. We thus maintain the possibility that silver may overshoot its next target and reach $25 within the next several months, which is an area of strong resistance dating back to 2012.
It is expected that silver will begin this next advance concurrently to gold’s breaking of its long-term downtrend, referenced in the gold analysis above.
Christopher Aaron,
Bullion Exchanges Market Analyst
Christopher Aaron has been trading in the commodity and financial markets since the early 2000’s. He began his career as an intelligence analyst for the Central Intelligence Agency, where he specialized in the creation and interpretation of pattern-of- life mapping in Afghanistan and Iraq.
Technical analysis shares many similarities with mapping: both are based on the observations of repeating and imbedded patterns in human nature.
His strategy of blending behavioral and technical analysis has helped him and his clients to identify both long-term market cycles and short-term opportunities for profit.
This article is provided as a third party analysis and does not necessarily matches views of Bullion Exchanges and should not be considered as financial advice in any way.
Share: