2016 has been one of the most volatile years on record for gold: the best first-half performance in 40 years, followed by the ongoing retracement that has seen the bulk of the gains for the metal itself given back.
These moves have left many wondering if this was just a “false rally” in the price of gold on the way to a continuation of the 2011-2015 bear market. And while no one can ever say with 100% certainty what the future will bring, with a clear technical view of the markets we are now in the best possible position to capture the moves that lie ahead when they do indeed materialize.
As there are still four trading days left in the year, we will wait until next week to offer a full 2016 year-end review of the precious metals markets and a look ahead for 2017.
Gold Analysis
Turning to spot gold itself, the pre-Christmas week featured relatively light trading, with prices finishing at $1,133 as of the final trade on the New York COMEX. Such represents a loss of $3.80 or 0.3% from a week prior.
Notably, this was the seventh weekly loss for gold in a row, the longest such stretch since May 2004. This is an interesting statistic to contemplate. Consider, for instance, that the last time gold fell for so many weeks in a row was during the early stages of the 2001 – 2011 bull market, not during a bear market. It is often said that the most severe (percentage per time unit) declines happen during bull markets, as prices must climb a “wall of worry”. Will this hold true again? We will know shortly.
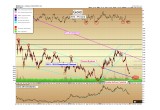
(See image A)
Technically, gold is now within sight of the declining broken 2013 – 2015 trend channel we have been monitoring for several weeks, shown in blue above. If the price were to use the broken trendline as support this week, the level to watch for a bounce would be $1,100 precisely. Such a rebound would indicate the potential for a higher-low to form in gold than in 2015. The 2015 bottom zone is labeled by the green band above as between $1,045 – $1,080.
We would place a stronger trust in the low if it were to form as a confluence of the broken blue trendline and the $1,045 – $1,080 support zone. For those two regions to overlap, the bottom would need to wait for the trendline to decline from its current reading at $1,100. Based on the slope of the line, that convergence would happen between February and May of the coming year.
Gold is still largely oversold on the daily RSI indicator (red circle, top of chart) below the 30 level, a reading which has corresponded with previous medium-term lows over the past 18 months.
In sum, a short-term bounce should be expected at any moment in gold; however, long-term bottom signals require several converging technical patterns, for which we are still waiting across both the metal and the mining complex.
Silver Analysis
Silver spot price fell further than gold again this week, giving up the relative outperformance we had noted during late November and early December versus gold. For the week, silver declined 2.8% or $0.46 cents, to close at $15.76 as of the last trade in New York.
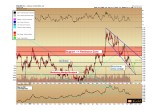
(See image B)
We would like to call your attention to the short-term steep wedge formation now visible on the silver chart above, shown between the teal and blue trendlines. As periodically mentioned, these wedge formation typically represent reversal or bottoming patterns. In this case, we see steep declining highs since early November, and less steep lows forming since July.
While silver could fall further still within the wedge pattern, a break of the upper trendline should represent a tradable breakout for those so inclined to initiate short-term trades. On the breakout, an initial target will be $16.25, the broken support from November, with a possibility of an advance toward $17.25, the resistance from early December.
However, a word of caution: breaks from wedges as steep as above cannot be relied upon to represent terminal bottoms in and of themselves. The old investment adage: “The steeper the trend, the less important the break,” comes to mind here, and is relevant because the wedge in question is extremely steep (for comparison, a less-steep long-term wedge was observed from 2013 – 2015 in the silver market, and represented a much stronger candidate for a bottom).
Because this wedge is so steep, it may not represent the final low for this retracement in silver. However, it should mark an end to the most severe portion of silver’s decline.
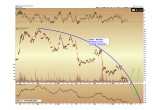
Another way to visualize the steepness of silver’s recent decline– and hence likelihood of a rebound in the near future — is to note that the slope can be observed to be forming a reverse parabolic curve since the summer highs, which is approaching an infinite downward rate by late January. Since such an infinite negative slope is impossible for an asset that cannot go to zero, we know that the current rate of decline will necessarily end in the next few weeks, and such should represent the tradable bounce at minimum. The only question is: does silver make its bounce sooner, or after one final drop over the next two weeks. Both options are highlighted in green, below, on the SLV chart (proxy for silver bullion, used to show intraday price/volume data).
(See image C)
The key technical point is to watch for the break of the wedge as shown on the main silver chart above to indicate when the worst of the retracement in silver is over.
We will put the full-year relative price performance together for gold, silver, and related markets in our 2016 review, next week.
________________________________________________________________________________________________________________
Christopher Aaron,
Bullion Exchanges Market Analyst
Christopher Aaron has been trading in the commodity and financial markets since the early 2000's. He began his career as an intelligence analyst for the Central Intelligence Agency, where he specialized in the creation and interpretation of pattern-of- life mapping in Afghanistan and Iraq.
Technical analysis shares many similarities with mapping: both are based on the observations of repeating and imbedded patterns in human nature.
His strategy of blending behavioral and technical analysis has helped him and his clients to identify both long-term market cycles and short-term opportunities for profit.
This article is provided as a third party analysis and does not necessarily matches views of Bullion Exchanges and should not be considered as financial advice in any way.
Share:


