We have a strong confluence of resistance levels within a tight range, this represents a high probability zone for the next gold target
We have maintained a target of $1,485 - $1,535 per ounce for gold by the end of 2018 for several months now. This target is based on a measurement of three technical levels which all occur within this $50 swath. As a reminder for new readers of this column, the three target levels we are referring to are:
- The consolidation from December 2015 through August 2017 featured an amplitude of $330 per ounce, from the low of $1,045 to the high of $1,375. This consolidation took place in the form of a giant triangle on the charts. In technical analysis when a triangle-consolidation break, the target is derived from an equal measurement of the amplitude ($330), added onto the apex of the triangle ($1,205). This calculation gave a target of $1,535.
- There is clear horizontal resistance visible on the long-term gold chart at $1,525 (black line). This level formerly acted as support on three occasions in 2011 – 2013 and then failed on the fourth attempt in early 2013. Generally, strong former support levels will subsequently act as intermediate-term resistance on the next attempt to overcome them, as those who previously purchased gold at these higher levels will choose to exit the market at break-even.
- The 50% Fibonacci retracement level of the entire 2011 – 2015 gold decline comes in at $1,485. Fibonacci levels are derived from a pattern which exists in many aspects of nature (such as seashells, hurricanes, and the spirals of the galaxies) called the Fibonacci sequence. Financial markets often follow these similar patterns, the markets being a component of (human) nature.
In sum, when we have a strong confluence of resistance levels within a tight range, this represents a high probability zone for the next target. For gold this comes between $1,485 - $1,535.
Record-Breaking Volume a Clue
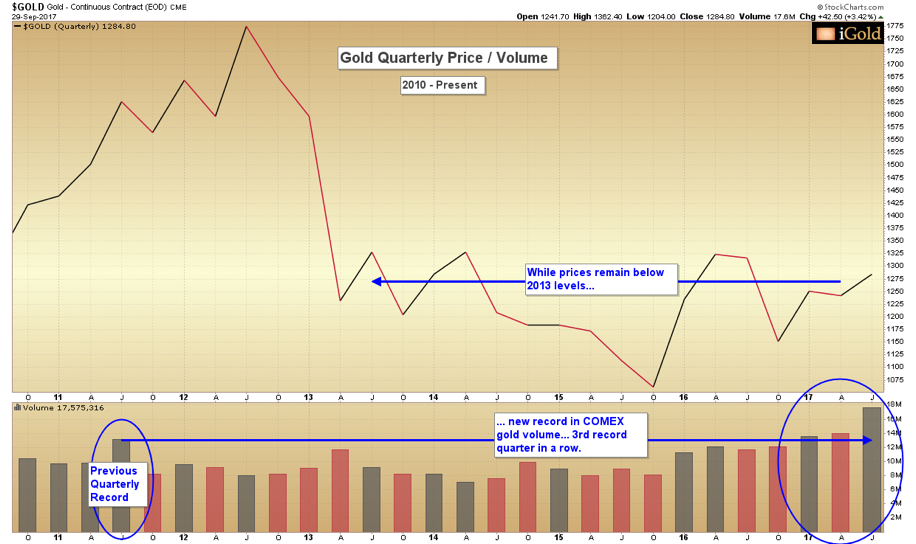
Meanwhile, we see clear signs that gold is gaining strength over the short run. As discussed in past articles, gold has already broken it's long-term 2011 – 2017 downtrend. What more, trading volume is picking up, to the extent that Q3 2017 (just closed on September 30) featured the highest quarterly volume of gold contracts traded of all time:
Image A
Further, we can see that this volume surge is occurring still as prices remain at or below 2013 levels. It is often said in a technical analysis that “volume precedes price movement”. These volume spikes are happening now, during the final period of what is still a 5-year basing process (overall flat prices since 2013).
What is shown in these volume spikes is an acceleration in the transfer of gold from weak hands to strong hands, as this base nears its terminal stages?
The Nature of Gold’s Base
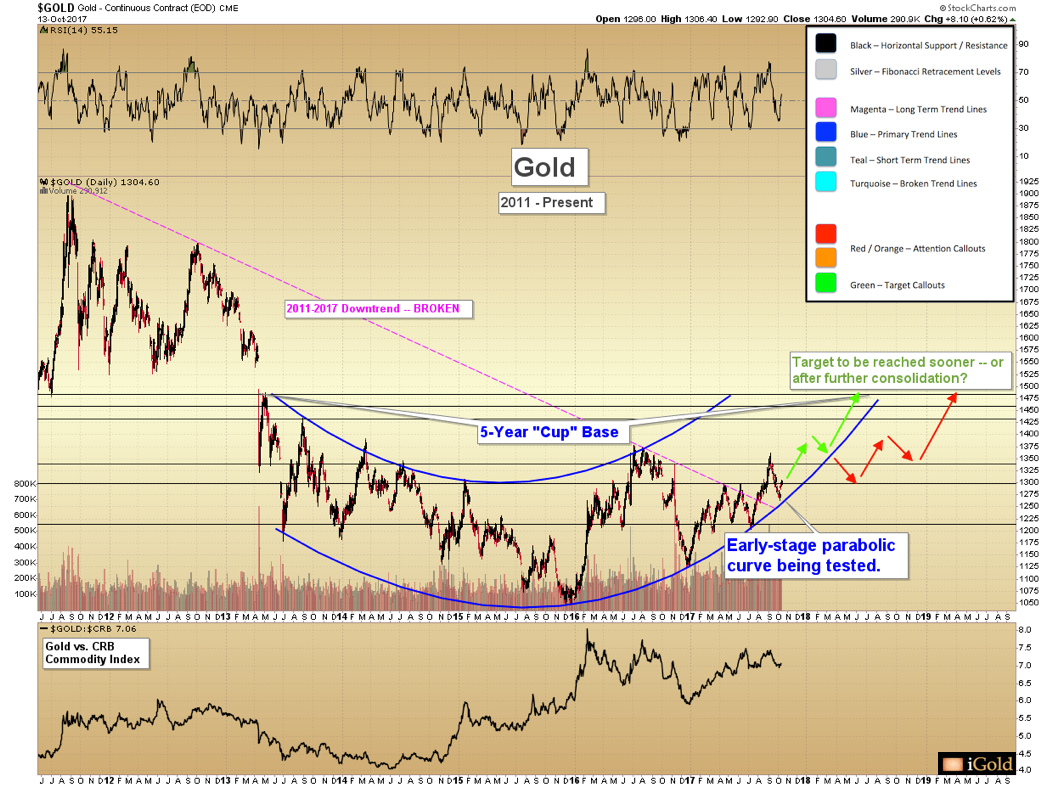
The question surrounding gold’s target remains the timing – and for this we must evaluate the developing shape of the ongoing 5-year basing pattern:
Image B
As we can see from the chart, gold’s 5-year basing pattern continues to fit the profile of an early-stage parabolic growth curve, in colloquial terms resembling the “cup” profile (blue). The lower range of the early parabolic curve has just been tested with gold’s low price of $1,262 from two Friday’s ago. Note the blue-callout which points to this location of gold’s recent test of the parabolic curve.
If gold can maintain its early-stage parabolic base pattern (green arrows, above) throughout the remainder of 2017, it argues that our $1,485 - $1,535 target will be reached sooner rather than later, likely by Q2 2018. This may seem improbable for the casual observer of the metals markets, as we have not seen prices that high since early-2013, but it is indeed what is expected given an early-stage parabolic curve which remains unbroken.
If gold fails to maintain this parabolic base (red arrows, above), nothing changes about the target of $1,485 - $1,535. It is only the timing that will change – such will be pushed out toward the end of 2018, possibly to extend into Q1 2019. In sum, in this scenario, more consolidation will need to occur between the recent low of $1,262 and the 2016 peak ($1,378), before gold is ready to advance.
Takeaway on Gold
Record-breaking volume is being witnessed coming into the gold market. This is occurring amidst a period of five years in which prices have moved generally sideways as a net sum. The message here is a market that is picking up interest and nearing the later stages of its basing process.
The remainder of the price action in 2017 will give us strong clues as to how soon our stated target zone will be reached. A continuation of an initial parabolic curve will bring a quicker target, while a breaking of this curve will result in a lengthier consolidation prior to the targets being reached.
Let us keep our eyes on gold carefully over the next three months.
Christopher Aaron,
Bullion Exchanges Market Analyst
Christopher Aaron has been trading in the commodity and financial markets since the early 2000's. He began his career as an intelligence analyst for the Central Intelligence Agency, where he specialized in the creation and interpretation of pattern-of-life mapping in Afghanistan and Iraq.
Technical analysis shares many similarities with mapping: both are based on the observations of repeating and imbedded patterns in human nature.
His strategy of blending behavioral and technical analysis has helped him and his clients to identify both long-term market cycles and short-term opportunities for profit.
This article is provided as a third party analysis and does not necessarily matches views of Bullion Exchanges and should not be considered as financial advice in any way.
Share: