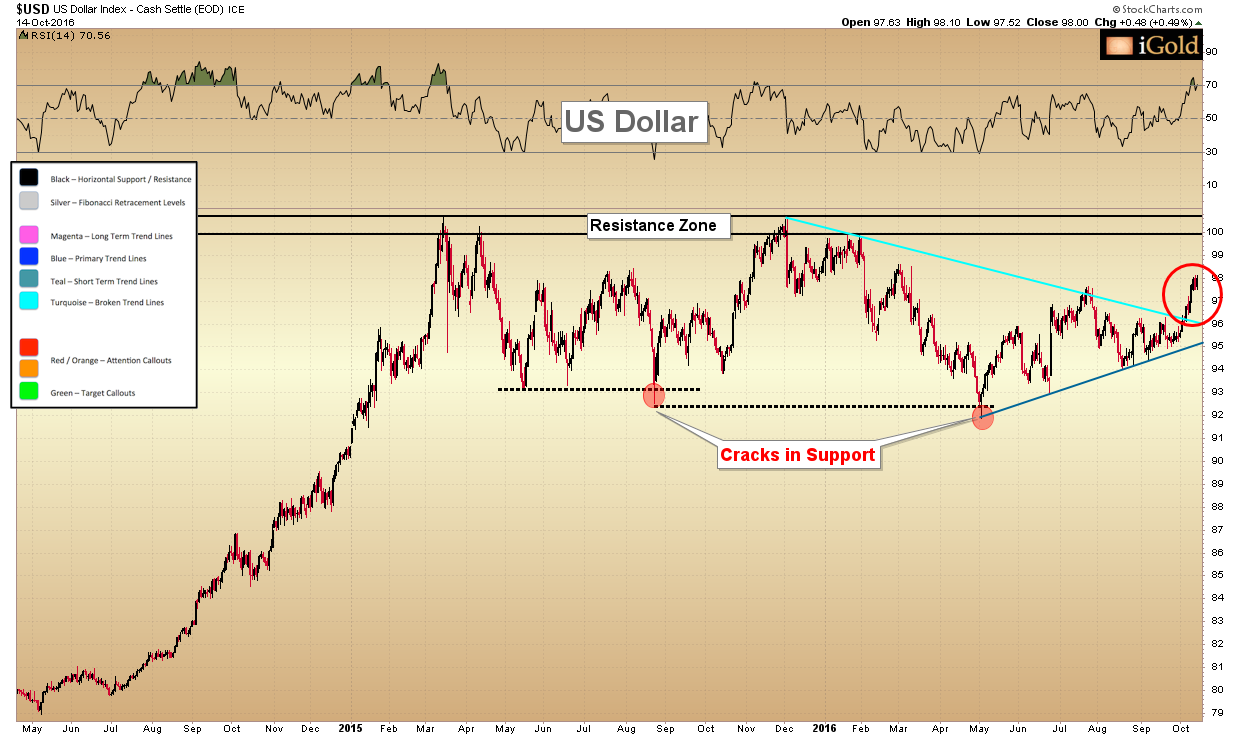
The big driver impacting the precious metals market this past week has been the US dollar. We have been watching this converging wedge formation in the dollar index, a measure of the US dollar versus a basket of foreign currencies, for several months, and this past week the formation broke higher in favor of the dollar .
The big driver impacting the precious metals market this past week has been the US dollar. We have been watching this converging wedge formation in the dollar index, a measure of the US dollar versus a basket of foreign currencies, for several months, and this past week the formation broke higher in favor of the dollar (see red highlight circle in the chart below).
(See image A)
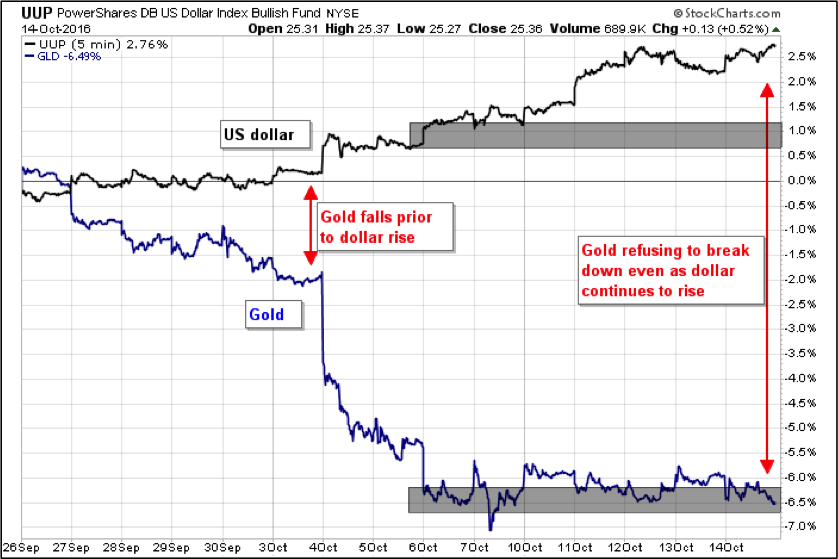
As we know, over the short run gold tends to move inversely to the US dollar.
Interestingly, gold had broken below its $1,305 consolidation support a week before the dollar broke higher from the pattern above. Gold, essentially, anticipated the strengthening of the US dollar prior to it actually occurring.
We can see the inverse correlation between the dollar and gold on the chart below clearly over the last 3 weeks.
(See image B)
Now since October 6, gold has been giving the opposite signal to the preemptive drop from late September. Essentially, gold has moved sideways in a consolidation since that date, even as the dollar has continued to rise.
What gold is saying over the last few weeks is that it doesn't "believe" the dollar's most recent advance is going to last.
Watching for a Top in the US Dollar
Refer back to the US dollar index chart at the top of the article.
Again, the dollar has broken higher from the wedge consolidation defined by the two converging trendlines since May of this year. Closing at 98 on the dollar index last week, it has been the 3 point move higher from 95 to 98 which has resulted in gold's drop from $1,315 to $1,250.
The dollar is now nearing another test of the 100 level on the index, a measure which has acted as resistance for the last two years.
We will be watching the action in the US dollar index carefully over the next few weeks. Should the dollar further levitate toward the 100 resistance zone while gold continues to hold its recent lows, it will be a strong signal that the dollar is putting in a long-term top in this region. Accordingly, the most recent decline in gold will be seen to be simply the first minor correction in the early phases of a long-term secular advance higher, an advance that ultimately should correspond with a worldwide awakening to the knowledge that all currencies -- not just the US dollar -- are inherently flawed in their present fiat form.
That said, and as we have witnessed, we should expect the most sizeable moves in gold to occur opposite the US dollar, as a weakening in the world's reserve currency will have an outsized impact on the entire world financial system as it is defined in the post-Bretton Woods era.
Let us watch the related moves in the dollar index and gold closely over the next several weeks.
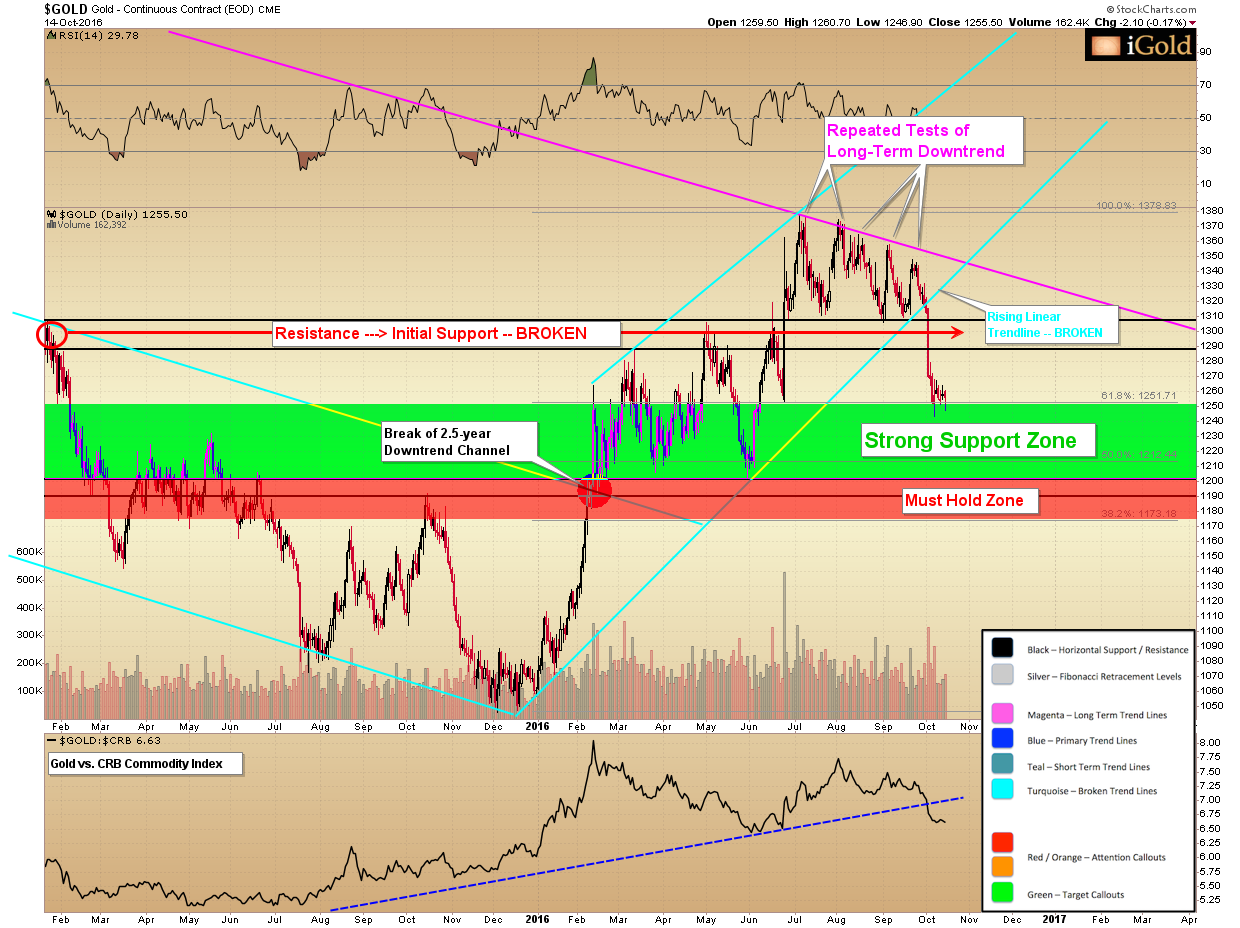
Gold Analysis
For the week, gold was up $3 from the Friday prior to close near $1,255 on the New York COMEX exchange.
The historic store of wealth is attempting to stabilize in the strong support zone we have identified below in green. Notably, thus far despite several intraday drops into the zone, buyers have stepped in each time and the precious metals has closed each day above the 61.8% Fibonacci retracement level of the entire December through July advance. This level comes in at $1,251.
(See image C)
The higher within the zone of $1,200 – $1,251 that gold can stabilize, the more likely that the long-term downtrend line (magenta color) will be broken on the next series of attempts, which early estimates suggest could occur as early as December.
As technical-based analysts also looking at downside potential, we continue to identify the $1,173 price level as the final “must hold” zone for gold’s new bull market. If this level were to breach, it would tell us that — despite the fundamentals that we know to be true (worldwide central bank money printing, unprecedented low interest rates, unsustainable debt levels) — another fundamental factor must then be impacting the markets that we must not be fully aware of.
One of the founding principles of our investment philosophy is we cannot possibly know ever factor that is impacting a set market at a given time, because the market is composed of hundreds of millions of individuals, each with their own set of hopes, fears, strengths, weaknesses, assumptions, research, and goals.
Yet to be successful, we do not need to know what each individual is thinking. By paying attention to the sum of the market — which manifests in the price that is printed each day — we can align ourselves with the strongest trend as it is occurring.
We have no desire to be right on the fundamentals but wrong on the actual market, a problem which plagues many fundamental-only based investors. As of now, it still appears that the December bottom was an important long-term flexion point… but if anything changes this outlook, we will be sharing it with you here.
Christopher Aaron,
Bullion Exchanges Market Analyst
Christopher Aaron has been trading in the commodity and financial markets since the early 2000’s. He began his career as an intelligence analyst for the Central Intelligence Agency, where he specialized in the creation and interpretation of pattern-of- life mapping in Afghanistan and Iraq.
Technical analysis shares many similarities with mapping: both are based on the observations of repeating and imbedded patterns in human nature.
His strategy of blending behavioral and technical analysis has helped him and his clients to identify both long-term market cycles and short-term opportunities for profit.
This article is provided as a third party analysis and does not necessarily matches views of Bullion Exchanges and should not be considered as financial advice in any way.
Share: