Given the potential for the pending low we are expecting across the precious metals in the next 2-3 months, it is important that we review gold priced in other major world currencies at this juncture.
If gold is going to form a bottom in US dollars, it is going to form concurrent bottoms at different but related key technical zones in other currencies during the same timeframe.
Conversely, if we observe major breakdowns in key technical levels in gold as priced in foreign currencies, it would give us clues that US dollar gold may be heading for new lows.
Although gold priced in US dollars is the worldwide standard for both trade and mining valuation, the bull market that we are expecting over the coming years is believed to be a worldwide phenomenon. Whereas in the 1970’s gold’s advance was mostly related to US dollar weakness after President Nixon severed the link to gold, today every currency in the world is fiat, and we have observed the precious metal moving higher over the last decade in multiple currencies.
This situation of not having a single currency backed by gold, in and of itself, is unprecedented, and so we now turn to gold as priced in four other major currencies for perspective on the faith (or lack thereof) other western citizens are placing in their own central bank’s regimes.
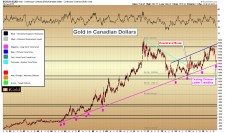
Gold in Canadian Dollars (CAD)
(See image A)
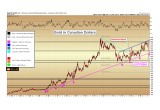
Gold in Canadian dollars hit a high of just over $1,800 over in the summer, with a second attempt to break this level negated following Trump’s victory.
Canadian dollar-gold has since given back nearly $300 to close just above $1,515 this week.
The critical technical position of gold in Canadian dollars is evident on the chart above by the long-term (magenta color) trendline that is now being tested. This test represents the second distinct hit on the trendline since breaking the 2011-2014 downtrend in mid-2014 (red callout, above). This trendline dates all the way back to 2005.
We can observe a fairly uniform rising channel having formed since CAD gold bottomed in 2013 at $1,250, with four successive higher highs and four successive higher lows since then.
If gold were to break down through the long-term trendline, it would give us reason for additional caution on US dollar gold.
If gold in US dollars is going to form the interim low we expect in early 2017, gold in Canadian dollars should hold its long-term rising trendline immediately and exceed $1,800 by 2018.
Gold in British Pounds (GBP)
(See image B)
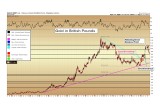
Gold in British pounds had bottomed at £700 in late 2015, before the 2016 advance reached over £1,050 post-Brexit. Since the US election, British pound-gold has given back £150 to close just above £900.
Gold in pounds is now retesting its Brexit breakout point at £900. This is the price below which the metal consolidated for most of 2016 prior to the vote.
From a technical perspective, we would expect to see second-chance buyers in the UK step in between £850 – £900 for an interim low.
If gold in US dollars is to form a double bottom in 2017 and then begin a new bull market, we expect, based on the ongoing weakness across pound sterling exchange rates, that gold in GBP will make new all-time highs as early as 2018.
Gold in Euros (EUR)
(See image C)
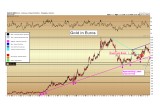
Gold in euros bears many similarities in trajectory to gold in Canadian dollars, yet with the swings in each direction since 2013 showing lesser volatility. Euro-gold bottomed in 2013 at just above €860, broke its downtrend from the 2012 high in January 2016, and has since formed a rising trend channel similar to that seen in CAD gold.
Since hitting €1,250 in July, euro-gold has come back into the middle of its rising trend channel just below €1,100. We will want to see this long-term (magenta color) lower trendline hold for an interim low, with a higher high to form sequentially by 2018 above €1,250.
Gold in Australian Dollars (AUD)
(See image D)
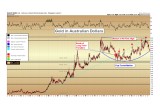
Gold as priced in Australian dollars is unique in that the price actually broke down in early 2013 from its long-term rising trendline, shown by the red highlight. Since then, AUD gold has formed a cup consolidation, retesting the 2011 high at $1,800 last summer.
Notably, AUD gold has failed to regain the broken trendline on five separate occasions since 2013 (red arrows). In technical analysis, broken support often becomes resistance, even in a trending market.
Yet the decline from the recent high down to $1,550 still fits in with the model of a consolidation. In this model, we are looking at a cup and handle continuation pattern, which, as shown in textbook example to the right, is derived from a tea cup setting of the same name.
Should AUD gold make a new all-time high above $1,800, it would be an early-warning signal that gold in other western currencies may be headed in that direction within a few years. (It is quite possible for a long-term trendline to break as it has for AUD gold, but for the market to continue on to new highs, albeit at a lesser rate of acceleration.)
A break below the $1,300 level would indicate the likelihood of a long-term double top at $1,800.
At present, the action between $1,300 and $1,800 must be viewed as consolidative in nature until one of those levels is broken.
________________________________________________________________________________________________________________
Christopher Aaron,
Bullion Exchanges Market Analyst
Christopher Aaron has been trading in the commodity and financial markets since the early 2000's. He began his career as an intelligence analyst for the Central Intelligence Agency, where he specialized in the creation and interpretation of pattern-of- life mapping in Afghanistan and Iraq.
Technical analysis shares many similarities with mapping: both are based on the observations of repeating and imbedded patterns in human nature.
His strategy of blending behavioral and technical analysis has helped him and his clients to identify both long-term market cycles and short-term opportunities for profit.
This article is provided as a third party analysis and does not necessarily matches views of Bullion Exchanges and should not be considered as financial advice in any way.
Share:

