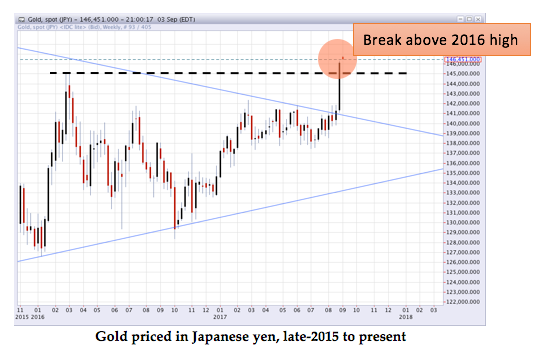
The most important news for precious metals investors was the price increase of gold in Japanese yen terms. Gold price broke above its 2016 high level.
The biggest news for the precious metals investors this week was not the gain in gold or silver, nor the continued weakness in the US dollar. The most important news for precious metals investors was the price increase of gold in Japanese yen terms. After several years of tight correlation, these markets are in the process of changing behavior, yet this important shift is still being largely ignored by the mainstream press.
In early August (Part 1 – Part 2) we covered the historically tight correlation that has existed between the Japanese yen and gold prices dating back to 2011. If you did not have the opportunity to do so, please check out those posts for a better understanding of the analysis that follows.
Gold in Yen Breakout
This week, gold, as priced in Japanese yen, broke above its 2016 high in sudden fashion, rising from ¥141,300 per ounce to ¥146,095, a gain of 3.3%. The technical action is highlighted below:
Image A
We made the case in the past linked articles that a key determinant for a more significant precious metals advance in US dollar terms would be when the strong correlation between the Japanese yen and gold prices begins to break down.
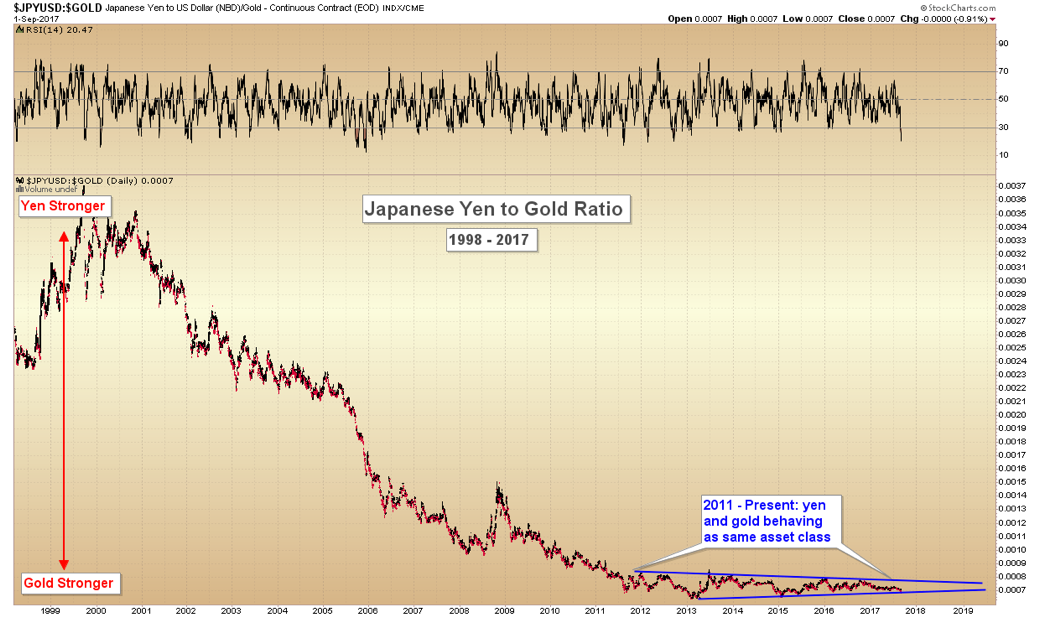
Below is the updated long-term ratio between yen and gold, which shows that the two have essentially acted as the same asset class as a net sum since 2011:
Image B
To see the 2016 high for gold in yen exceeded this week tells us that the 6-year correlation is beginning to weaken. It is the breaking of this correlation which will eventually help gold to assume its proper role as safe-haven of last resort.
We will look for a major advance at gold prices worldwide to correspond with a breaking of the lower (blue) trend line of the Japanese yen/gold ratio, which should begin with gold breaking above ¥151,000 per ounce, or a 3.5% further gain as priced in yen from last week’s close. This could occur within the next 2-3 weeks.
North Korea Fires Missile Over Japan… Tests Hydrogen Bomb
We never like to attribute one single cause to a market reaction. After all, the market is the sum of millions of distinct individuals, each acting upon their own unique beliefs, strengths, and fears.
image C
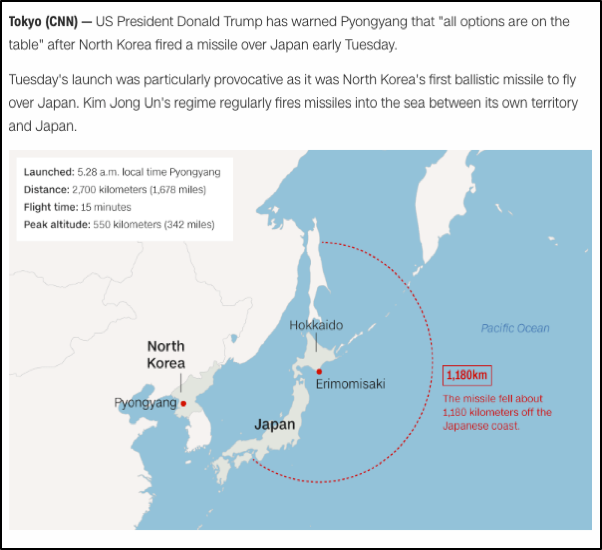
That said, it is likely that a portion of the movement into gold by Japanese investors this week was due to fears over North Korea. The latter is noted to have – for the first time ever – launched a ballistic missile directly over Japan, which then landed east off the coast in the Pacific Ocean.
North Korea is subsequently reported to have tested a hydrogen bomb on Sunday.
Tensions are certainly high between the United States, North Korea, and Japan, and while gold price spikes due to isolated geopolitical tensions are typically short-lived, those which foreshadow lengthy periods of conflict tend to be important early-warning indicators for more sustained price advances to develop throughout time.
It is too early to say with any certainty how the current standoff between these nuclear powers will end, but by breaking above 2016 highs on the chart, gold priced in Japanese yen is signaling something important for those who would listen: the correlation between the two safe-havens is breaking… in favor of gold.
Takeaway on Gold
It is unlikely that the 6-year tight correlation will end in one week, but initial hints that this is in progress are plainly visible on the charts. We will continue to monitor this development at regular intervals for the foreseeable future.
All asset correlations eventually change. When gold begins to advance in yen terms it signifies that the precious metal is picking up on new fundamentals, and set to be the safe-haven of last resort.
For the upcoming week, we watch to see if gold can match its similar 2016 high in US dollar terms, which comes in at $1,378.
Christopher Aaron,
Bullion Exchanges Market Analyst
Christopher Aaron has been trading in the commodity and financial markets since the early 2000's. He began his career as an intelligence analyst for the Central Intelligence Agency, where he specialized in the creation and interpretation of pattern-of-life mapping in Afghanistan and Iraq.
Technical analysis shares many similarities with mapping: both are based on the observations of repeating and imbedded patterns in human nature.
His strategy of blending behavioral and technical analysis has helped him and his clients to identify both long-term market cycles and short-term opportunities for profit.
This article is provided as a third party analysis and does not necessarily matches views of Bullion Exchanges and should not be considered as financial advice in any way.
Share: