Gold has now made its most legitimate breakout attempt - and furthermore, it has sustained the breakout for two full weeks.
Two weeks ago gold broke higher through the long-term declining downtrend which has defined the period of falling prices since 2011. That year, gold peaked at $1,923 per ounce, while silver peaked just shy of $50. Over the past six years, despite many attempts to gather momentum to the upside, gold has been unable to overcome this key technical resistance level.
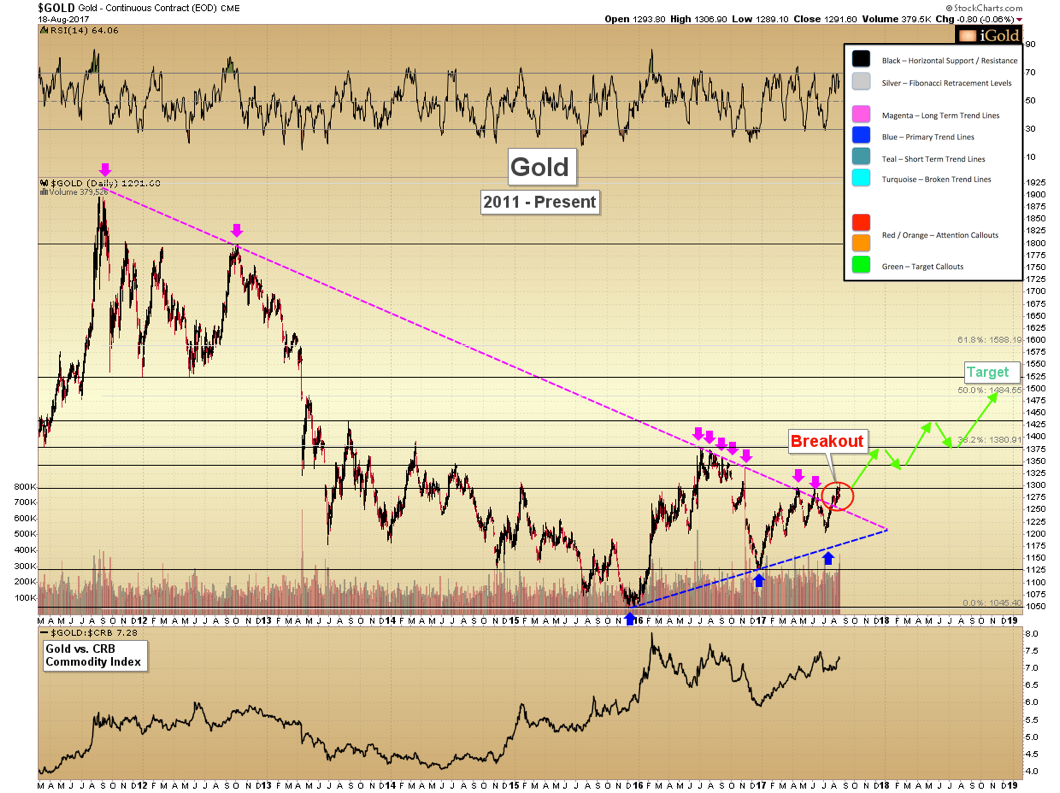
Since the surge of first-half 2016, gold has made no less than seven attempts to overcome this downtrend. Those attempts are highlighted on the chart below by the magenta-colored arrows. Each time gold reached this declining trend, sellers showed up, and forced the price back lower – sometimes by only $40 - $50 per ounce, yet sometimes by over $200 per ounce, as was seen last November.
Image A
Gold has now made its most legitimate breakout attempt – and furthermore, it has sustained the breakout for two full weeks.
Before we examine price projections, we must note that for the breakout to remain valid, prices must remain above $1,260 on a daily closing basis. If this level were to fail, it would invalidate the breakout, and we would have (once again) another failed attempt. False-moves are possible in all markets, and the best way to handle them is to have a defined price point whereby if a failure occurs, we can examine alternate scenarios. Again, $1,260 must hold – and thus far, prices have done so.
Breakout Importance
The importance of this trend break should not be underestimated. Many technical-based buyers have remained on the sidelines for the past six years as gold prices moved lower and then drifted sideways. A sustained break above a declining trendline is often a signal that investors will use to tell them the period of falling prices is likely over. We expect these investors will begin entering the gold market in the near future, and momentum will begin to build.
Short-Term Resistance Levels
Over the next several weeks, gold still must overcome the $1,300 zone as initial resistance.
$1,300 has held prices lower since the reversal which took place on the night of Trump’s victory, last November. This is presently the third attempt for gold to overcome this price, and each attempt represents a “chipping away” by buyers at the overhang of sellers who are exiting their positions near break even.
What will typically happen as a specific horizontal resistance level is preparing to be broken is that the reactions lower on each failure will become less and less severe, indicating buyers are stepping in at higher price points at every sell-off. In the near future, we expect $1,300 will be broken – and at that point, a whole new class of buyers will begin paying attention to the precious metals market.
Intermediate Price Targets
Assuming gold can remain above $1,260 and soon recapture $1,300, thus solidifying the long-term downtrend break, we have much higher price targets ahead over the next 6-18 months.
Three specific price targets occur within a close proximity, and this confluence represents our highest probability target:
- The consolidation which took place from December 2015 through August 2017 featured an amplitude of $330 per ounce, from the low of $1,045 to the high of $1,375. This consolidation took place in the form of a giant triangle-shaped formation. In technical analysis when triangle-consolidation breaks, the target is derived from an equal measurement of the amplitude ($330), added onto the apex of the triangle ($1,205). This calculation gives a target of $1,535.
- There is clear horizontal resistance visible on the chart at $1,525 (black line). This level formerly acted as support in 2011 – 2013 and then failed on the fourth test in early 2013. Generally, defined former support levels will subsequently act as resistance on the next attempt to overcome them as sellers emerge.
- The 50% Fibonacci retracement level of the entire 2011 – 2015 decline comes in at $1,485. Fibonacci was an Italian mathematician of the 12th century who discovered that many aspects of nature – sea shells, hurricanes, flower petals – all follow a similar ratio pattern. Financial markets often follow these similar patterns, the markets being a component of (human) nature.
Takeaway on Gold
In sum, we have three strong technical targets between $1,485 - $1,535, and this level represents our highest probability for a future intermediate gold peak.
These targets should be reached within 6-18 months, depending on the host of geopolitical and market factors impacting the precious metals. These represent starting targets only, at which point new analysis will be required.
Assuming gold maintains above $1,260 in the coming weeks, this technical breakout is significant and bears monitoring by investors. We expect that when $1,300 is broken, momentum will begin to pick up notably on the way to the higher targets. Investors may choose to accelerate a certain percentage of purchases as fitting in with an overall investment plan.
Christopher Aaron,
Bullion Exchanges Market Analyst
Christopher Aaron has been trading in the commodity and financial markets since the early 2000's. He began his career as an intelligence analyst for the Central Intelligence Agency, where he specialized in the creation and interpretation of pattern-of-life mapping in Afghanistan and Iraq.
Technical analysis shares many similarities with mapping: both are based on the observations of repeating and imbedded patterns in human nature.
His strategy of blending behavioral and technical analysis has helped him and his clients to identify both long-term market cycles and short-term opportunities for profit.
This article is provided as a third party analysis and does not necessarily matches views of Bullion Exchanges and should not be considered as financial advice in any way.
Share: