Having fallen for five weeks straight since the Trump victory, gold this week broke through its final technical support of the 2016 advance, the 61.8% Fibonacci retracement of the entire surge, at $1,173, so we must now shift our focus toward identifying the next low that is set to come. For the week, gold fell 1.4% to close at $1,159 as of the final electronic trade in New York on Friday.
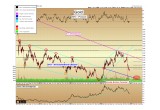
The intermediate-term 3-year chart is the most helpful perspective at this juncture:
(See image A)
Two weeks ago, we highlighted the example of the 1999-2001 double bottom for gold, and how this might look should the same pattern play out again, 16 years later. Having seen the continued weakness in gold over the last two weeks, let us now focus on some additional specifics.
The 2013 - 2015 downtrend channel, seemingly forgotten last summer, is the next potential whereby gold should attempt to begin carving out a double bottom. For reference, the channel was formed by five separate hits each on the upper and lower trendlines from 2013 onward, as shown above by the red and orange highlight circles on the chart. It was as clear of a trend channel as we could possibly ask for -- and it was broken in February 2016 as gold exceeded $1,190.
Since that trend channel was indeed declining, even though gold has now come back below the $1,190 breakout point, the precious metal still finds itself above the upper boundary of the channel.
Markets often come back to re-test broken lines and channels, and in this case gold spot price looks to be setting up for that retest within the next 3-4 months.
The retest of the trend channel should correspond, plus or minus a few percentage points, with the low for the 2015 bottom, at $1,045. Typically in long-term double bottom scenarios, the second low will fail to reach the depths of the initial low by several percentage points. Thus, our double bottom potential exists from $1,045 through $1,080, as shown by the green band above. The possibility of a nominal new low in gold forming alongside a double bottom in the gold mining sector should also not be ruled out.
Silver Update
Silver finished the week positive for the second week in a row, up $0.13 or 0.80% to close at $16.97 as of the final COMEX trade in New York.
This was the second week in a row that silver spot price has moved in an opposite direction as gold when viewing the weekly closing prices. Silver outperformance should be noted to be positive relative strength, which has ramifications for the entire sector, and fitting in with our thesis that a complex long-term bottom is forming in the precious metals, even if the absolute lows remain ahead of us.
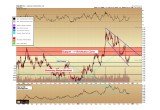
The rally this week was halted exactly at the broken support-turned-resistance zone shown below by the black line at $17.25. A break above this $17.25 resistance would hint that a short-term bottom is in the process of forming, although we will feel much more comfortable that the larger decline is over when the upper blue downtrend line is broken, which now comes in at $18.45.
(See image B)
Christopher Aaron,
Bullion Exchanges Market Analyst
Christopher Aaron has been trading in the commodity and financial markets since the early 2000's. He began his career as an intelligence analyst for the Central Intelligence Agency, where he specialized in the creation and interpretation of pattern-of- life mapping in Afghanistan and Iraq.
Technical analysis shares many similarities with mapping: both are based on the observations of repeating and imbedded patterns in human nature.
His strategy of blending behavioral and technical analysis has helped him and his clients to identify both long-term market cycles and short-term opportunities for profit.
This article is provided as a third party analysis and does not necessarily matches views of Bullion Exchanges and should not be considered as financial advice in any way.
Share:


