The message of the market remains: gold is retesting the breakout from it's long-term 2011 - 2017 trendline while silver breaks lower.
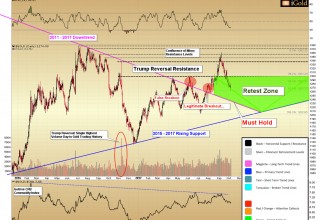
Gold has fallen further over the past week from the correction zone between $1,283 - $1,301 which would have constituted an ideal 38.2% - 50.0% Fibonacci retracement of the July through September advance. However, as discussed in the gold update two weeks ago, the precious metal could fall all the way back down to $1,240 at this juncture without violating the technical model.
The message of the market remains: gold is retesting the breakout from it's long-term 2011 – 2017 trendline, shown below in the magenta color. The retest zone is now highlighted in green for greater clarity on the intermediate-term chart:
Image A
For the week as a sum, gold fell nearly $10 or 0.8%, to close at $1,275 as of the final trade on the New York COMEX for the December futures contract.
Interestingly, silver bucked the gold trend and finished higher for the week by $0.11 cents or 0.7% to close at $16.79. This represents a falling in the gold to silver ratio (the number of ounces of silver required to purchase one ounce of gold) over the short term.
Lessons from a Falling Gold to Silver Ratio
The notable action in silver versus gold last week warrants an updated look at this important ratio. (For the chart below, we must switch over to the trading desk because it allows us to view intraday price data, as opposed to COMEX-only price data, as with our usual provider.)
Image B
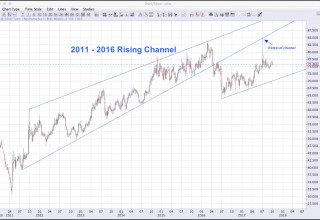
The important points to recall regarding the gold to silver ratio from 2011 through the present:
- The 2011 – 2016 rising channel in the ratio generally corresponded with falling precious metals prices, as gold held its value better on a relative basis.
- The major 2016 surges in both gold and silver occurred amidst the ratio breaking lower through the rising channel in April 2016, falling from 84 down to 64 ounces of silver required to purchase one ounce of gold by July 2016.
- Since July 2016, as both metals have corrected in price, the gold to silver ratio has been in a general rising trend again.
- At the depth of silver’s Flash Crash in July, the ratio peaked at 85, just touching the lower broken boundary of the 2011 – 2016 channel. This was a retest of the broken channel, labeled on the chart, and it represented a spike high – a level which was quickly rejected by the market.
Again, the 2011 – 2016 rising channel was decisively broken during 2016’s metals surge. This was an important signal of a long-term trend change, of which we are still in the early stages.
We expect the next major surge in both metals prices to occur when the gold to silver ratio breaks lower from its secondary rising trendline, which is shown on the chart above beginning in July 2016.
Currently, this level would come in at 70 ounces of silver required to purchase one ounce of gold.
Takeaway on Precious Metals Prices This Week
If indeed the low for the present retracement has been seen as of Friday with gold touching $1,260 and silver briefly dipping to $16.30, gold will have made a correction that falls still within the valid retest zone of it's long-term 2011 – 2017 downtrend.
The outperformance of silver on Friday is an early positive sign for the sector as a whole.
We continue to expect gold will eclipse its 2016 high of $1,378 on the next primary wave higher, while silver may lag on a relative basis with respect to the time required to break its own high of $21.25. Any such lag in silver should be looked at as an opportunity.
Christopher Aaron,
Bullion Exchanges Market Analyst
Christopher Aaron has been trading in the commodity and financial markets since the early 2000's. He began his career as an intelligence analyst for the Central Intelligence Agency, where he specialized in the creation and interpretation of pattern-of-life mapping in Afghanistan and Iraq.
Technical analysis shares many similarities with mapping: both are based on the observations of repeating and imbedded patterns in human nature.
His strategy of blending behavioral and technical analysis has helped him and his clients to identify both long-term market cycles and short-term opportunities for profit.
This article is provided as a third party analysis and does not necessarily matches views of Bullion Exchanges and should not be considered as financial advice in any way.
Share:


