The volatility in the gold market could increase massively throughout the second half of 2017 and into 2018. Gold is in the process of forming a long-term breakout.
On a semi-regular basis, we find it helpful to revisit the longer-term perspective for the precious metals, so that short-term price action does not dominate our focus. This will be important shortly as, despite what may seem like a volatile market over the past few months, we have reason to believe that the volatility in the gold market is set to increase massively throughout the second half of 2017 and into 2018.
Gold is in the process of forming a long-term bottom, but the challenge is that long-term bottoms often feature prices which can see a series of retests and/or nominal new lows throughout a multi-year basing period.
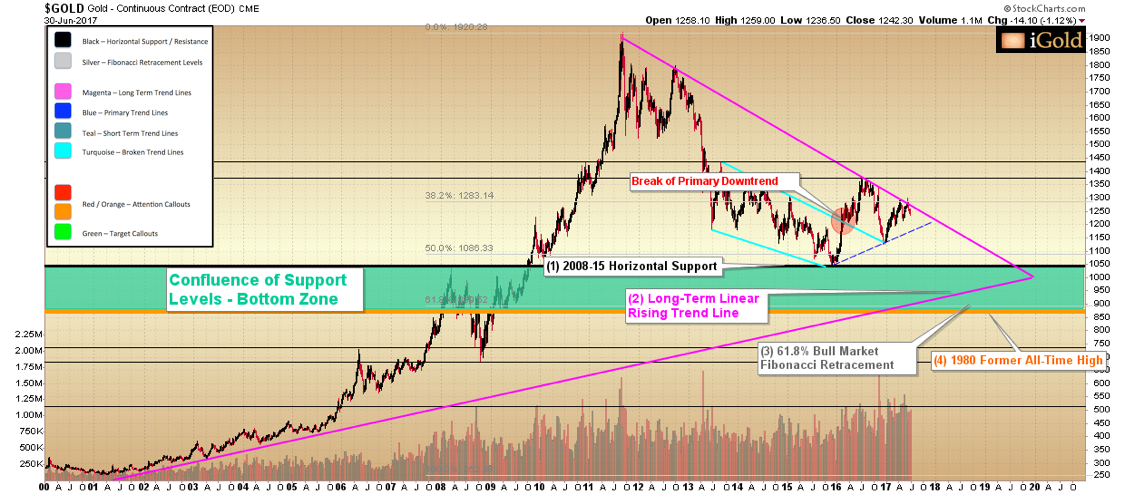
On the 20-year gold chart below, we see a confluence of four major technical support levels between the $850/ounce and $1,045/ounce levels. Whenever there is a confluence of technical targets within a certain price band, it represents a high-confidence level for a major low to form. While the following zone is too wide for short-term traders, it should give a reliable long-term support target for investors with a multi-year time horizon.
The levels are labeled below:
- The 2008 – 2015 horizontal support at $1,045.
- The long-term rising linear trendline which started in 2001, now at $900.
- The 61.8% Fibonacci retracement of the entire 2000 – 2011 advance, which comes at $890.
- The former 1980 all-time closing high, which comes at $850.
Image A
It remains possible that the absolute low for gold was formed in December 2015 at $1,045, but the likelihood of a retest of that level and/or nominal new lows is still significant.
A break of gold’s long-term declining 2011 – 2017 downtrend would give us increased confidence that the absolute low has already been formed, but this key technical breakout has remained elusive despite multiple attempts over the previous year.
Gold Short-Term
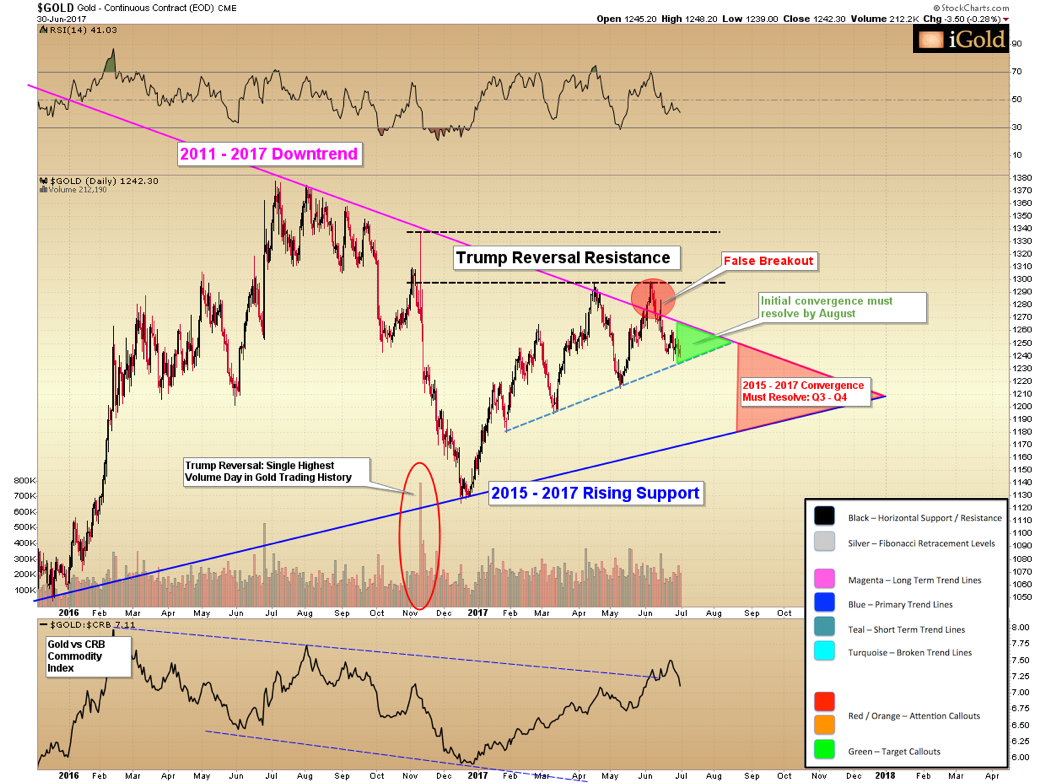
Zooming into the 18-month view, gold is extremely “tight” on the short-term chart, caught between its falling long-term downtrend (magenta) and its short-term rising trend from January (dashed teal color). These two trends are converging within the next six weeks, and when this happens one must necessarily break.
The immediate area of concern is highlighted below in green:
Image B
A break lower from this short-term green triangle opens up an initial decline to the $1,160 level in Q3, corresponding with the rising blue trend forming the lower boundary of the pennant-shaped consolidation.
Conversely, a break higher would be an important signal of a market set to start a new multi-year advance.
We truly are approaching a crossroads for the precious metal on the short-term chart.
Volatility Confirms Significant Move Ahead
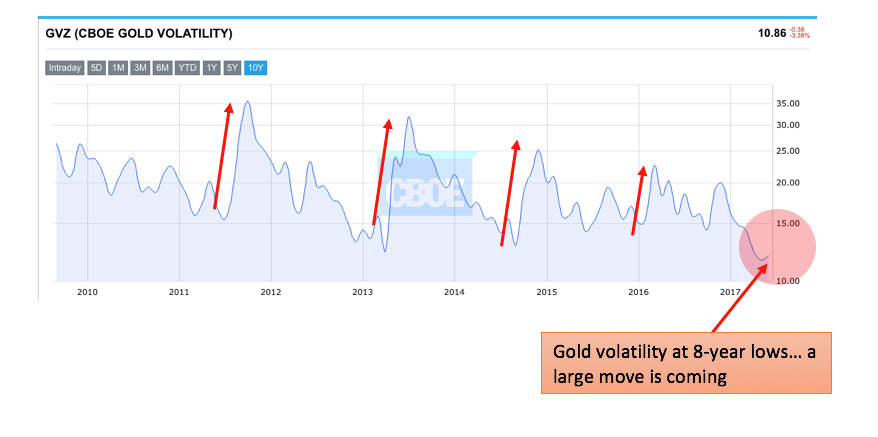
That a large price move is coming for gold can also be seen by examining volatility. Below is an index which trades on the Chicago Board of Exchange (CBOE), which tracks the daily volatility of gold futures contracts. The index is shown since 2010:
Image C
As we can see, gold volatility is now at 8-year lows.
Volatility is inherently a neutral market expression – in other words when volatility is low, it only tells us that a period of higher volatility is set to follow. However, it does not tell us in which direction the strong movement will occur.
The CBOE volatility index is confirming that either a surge or a significant decline is to come in gold, depending on which direction the consolidation breaks.
How Would This Look on the Long-Term Chart?
The long-term chart on page 1 is now stripped of its annotations so that we can envision how either a breakout higher or lower – as predicted by both our technical analysis and the record low volatility of present – would manifest in the market.
Technical analysis is about identifying high probability scenarios based on observable trends in the marketplace. It is no crystal ball, but it does help establish reasonable expectations.
Again: the breakout either higher or lower must begin by Q3 – Q4. This is based on the convergence of the pennant consolidation visible in the 18-month gold chart.
A breakout higher should see an initial advance to target 2016 highs near $1,375 per ounce, followed by a modest retracement, en route to the $1,535 in 2018.
Conversely, a break lower should see a rapid plunge to retest 2015 lows at $1,045, followed by a modest recovery, which would then open up the possibility of new lows within the green support band below $1,000.
Worst Case Scenario
We maintain that even the worst-case scenario of a drop below $1,000 will represent part of a larger multi-year bottoming process – and so: how one should consider preparing is largely dependent on one’s individual time the horizon and risk tolerance.
Those with shorter-term time horizons should be cautioned that if new lows formed, it could take gold several more years of basing to regain its upward trajectory. Yet accumulation throughout any final plunge would be a healthy plan for those looking to accumulate holdings as part of a long-term strategy.
Christopher Aaron,
Bullion Exchanges Market Analyst
Christopher Aaron has been trading in the commodity and financial markets since the early 2000's. He began his career as an intelligence analyst for the Central Intelligence Agency, where he specialized in the creation and interpretation of the pattern of life mapping in Afghanistan and Iraq.
Technical analysis shares many similarities with mapping: both are based on the observations of repeating and imbedded patterns in human nature.
His strategy of blending behavioral and technical analysis has helped him and his clients to identify both long-term market cycles and short-term opportunities for profit.
Share: