We anticipate gold has just formed an important price low in the $1,240 region last week. A period of consolidation with an upward bias is expected.
Gold has either this past week put in an important price low, or it is extremely close to doing so. Regular readers will know we are not engaged in short-term trading at this juncture, and so the exact price bottom is not as important to us. What is important is the primary direction of the market, and several overlapping models show that the direction is set to resume higher.
First, the bad news. As we expected, this past Wednesday the Federal Reserve hiked interest rates for the fifth time in the present cycle, to a new range between 1.25% - 1.50%. For reference, the Fed began to hike exactly two years ago, in December 2015, from a record low range of 0.00% - 0.25%. What is different this occasion is that this was the first rate hike which did not feature a higher associated gold price. With a close of $1,255 on Wednesday afternoon, gold came $5 shy of its close on the day of the last Fed rate hike, which was $1,260 on June 14. The series of higher interest rates and higher associated gold prices have thus officially ended.
Does this then mean then that the thesis of higher interest rates being supportive of higher gold prices has failed?
An Example from History
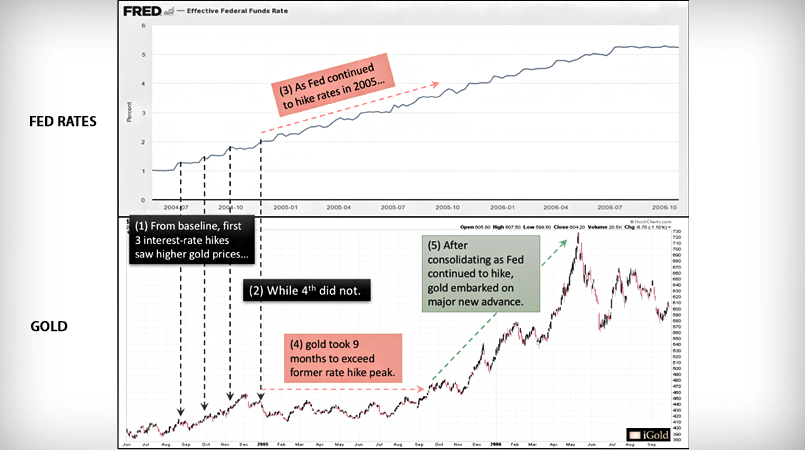
While we cannot rely on history to provide a perfect model for every twist and turn, let us examine the most prescient example from history in close detail, the most recent rising interest rate cycle from 2004 – 2006, and how gold responded:
Image A
Reference the following points:
- As the Fed began to raise interest rates in 2004 from a low of 1.0%, gold began to rise for each of the first three hikes, reaching higher peaks in the mid-$400’s as the year progressed.
- On the 4th rate hike in late December 2004 to 2.0%, gold did not reach a new price high. It remained equal to its past-hike level of $440 per ounce.
- As the Fed continued to hike rates in 2005 to 3.5%, gold did not make new price highs. It consolidated within a 10% range, between $410 - $450 per ounce, as the Fed continued to rise throughout the year.
- In September 2005, gold finally exceeded its former high of $450.
- Within the next eight months, gold rose 62% to reach a new high for the cycle of $730 per ounce, even as the Fed continued to hike rates to 5.25%.
The essential points are thus:
- Gold can thrive in a rising interest rate environment.
- Gold need not rise precisely at each individual rate hike for the overall trend to remain intact. Gold may consolidate during a series of hikes, then to play catch up when a specific technical level is finally exceeded.
Our best assessment is that a similar scenario is now playing out as in the 2004 – 2006 example. Gold has risen after four of the first five interest rate hikes, the first increases since the last decade, and this cycle appears to be playing out similarly to the previous model. The only difference is that this time, interest rates have begun at an even lower level than in 2004 (0% versus 1%) while gold has started at an even higher level ($1,045/oz versus $385/oz). And in the present example, the recent technical levels that gold must break are the 2016 highs, near $1,378 per ounce. All of the price action below this level over the past 18 months has represented one giant consolidation.
Takeaway on Gold and Fed Interest Rates
We anticipate gold has just formed an important price low in the $1,240 region last week. A period of consolidation with an upward bias is expected, even as the Fed continues to raise rates further in 2018. When gold finally exceeds 2016 highs, we expect a significant new surge, similar to the 2004 – 2006 breakout.
The major trend is still for rising interest rates, and history shows this is positive for precious metals prices, even if each individual hike does not match rising metals precisely to the day. Let us not lose the forest for the trees.
Christopher Aaron,
Bullion Exchanges Market Analyst
Christopher Aaron has been trading in the commodity and financial markets since the early 2000's. He began his career as an intelligence analyst for the Central Intelligence Agency, where he specialized in the creation and interpretation of pattern-of-life mapping in Afghanistan and Iraq.
Technical analysis shares many similarities with mapping: both are based on the observations of repeating and imbedded patterns in human nature.
His strategy of blending behavioral and technical analysis has helped him and his clients to identify both long-term market cycles and short-term opportunities for profit.
This article is provided as a third party analysis and does not necessarily matches views of Bullion Exchanges and should not be considered as financial advice in any way.
Share: