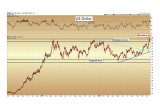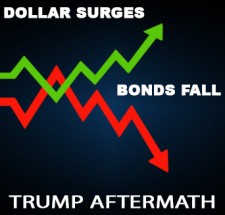
In the wake of the Trump election, the US dollar has broken out higher from the two-year consolidation that we have been watching now for many months. Held between the 92 support level and the 100 resistance zone since the beginning of 2015, the dollar hit a high of 101.5 last week, decisively breaking through the aforementioned resistance.
In the wake of the Trump election, the US dollar has broken out higher from the two-year consolidation that we have been watching now for many months. Held between the 92 support level and the 100 resistance zone since the beginning of 2015, the dollar hit a high of 101.5 last week, decisively breaking through the aforementioned resistance.
This is important to monitor because over the short and intermediate-term, the precious metals often move counter to the value of the US dollar. (Over the long run, we can clearly observe that gold is rising regardless of fluctuations in the US dollar versus other world currencies. More on this below.)
(See image A)
The target for a successful breakout of this nature is derived as equal to the amplitude of the prior consolidation. The fundamental reason for this target is that an equal number of trapped short-sellers who placed their bets during the consolidation are likely to cover their shorts as the breakout advances, thus driving the dollar higher. The prior consolidation featured an 8 point amplitude (100 – 92). Thus, we expect the US dollar to advance to approximately 108 on the index over the next 6-12 months.
If gold spot price were to fall below $1,200 and toward the 2015 lows of $1,045 again, it would be because paper traders are reacting to this advance now setting up in the dollar.
Longer term, let us never forget that an attempt to determine what the price of gold will be at a given value of the US dollar versus other depreciating currencies is akin to trying to decide which ship is best to stay on amidst the certainty that all ships will sink during an approaching typhoon.
The truth is: all ships will be sinking, just at different rates. Gold is the life raft.
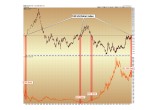
The proof for this can be seen in the long-term view of the US dollar index versus gold, where we update the levels at which gold has traded corresponding to the 100 point on the dollar index. Note that since 1980, gold has traded at $700, $275, $375, and $1,200 all while the US dollar has essentially made a round trip back to 100.
As the mainstream media continuously attempts to discredit gold based on movements in the dollar index, it is important that we keep this long-term perspective in mind at all times.
(See image B)
Bond Selling Continues After Trump Victory
US bonds continue to see major selling since Trump’s victory, to the extent that the benchmark 30-year US Treasury bond has seen its interest rate rise from 2.55% to 3.01% since the election.
We have long speculated that the final top to the unprecedented 36-year advance in US bonds was nearing an end. Yet bull markets typically end with a bang and not a whimper, and this backdrop usually takes the form of a bubble during the later stages. Bubbles can be spotted on the charts as a multi-year linear advance becomes parabolic during its later stages.
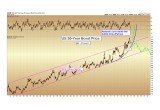
The selling seen over the last two weeks in the bond market brings this idea to the forefront, as bond prices have hit 152, just touching the parabolic curve (blue on the chart below) that we believe is setting up to mark the bubble-like end of this long-term advance.
The only question is: do bond prices have one final surge higher to go to mark a true mania phase in US paper, or has the top already been put into place?
The two trajectories, one envisioning a final blow-off phase for bonds and one assuming that the top has already been put into place, are outlined in green below.
(See image C)
A determining characteristic of bubbles is that they go on longer and higher than almost anyone can fathom, so whether the final top was just put into place, or whether there needs to be one final surge to new all-time highs in bond prices remains to be seen. What we can say is that most people alive today have never seen a bear market in bond prices during their investment careers — and now after 36 years of rising, it is equally fathomable that bond prices could see 36 years of selling. The ramifications of this are unimaginable, but due to unprecedented debt levels worldwide, most governments could not withstand interest rates above 5%, let alone rates near 14% or 15%, as were seen during the 1970’s and 1980’s.
Will governments insist that central banks be their buyers of last resort as legitimate demand for bonds falls in the coming years?
The only source of funding that central banks have for this is the printing press (i.e. electronic equivalent). Future gold prices will thus be largely impacted by the bursting of the bond bubble.
———-
Thursday, November 24 is Thanksgiving here in the United States. Major markets will be closed. There will be a half-day (until 1:00pm) of trading on Friday. In sum, markets should be rather slow starting Wednesday afternoon through the end of the week.
Happy Thanksgiving and enjoy the long weekend ahead!
Christopher Aaron,
Bullion Exchanges Market Analyst
Christopher Aaron has been trading in the commodity and financial markets since the early 2000's. He began his career as an intelligence analyst for the Central Intelligence Agency, where he specialized in the creation and interpretation of pattern-of- life mapping in Afghanistan and Iraq.
Technical analysis shares many similarities with mapping: both are based on the observations of repeating and imbedded patterns in human nature.
His strategy of blending behavioral and technical analysis has helped him and his clients to identify both long-term market cycles and short-term opportunities for profit.
This article is provided as a third party analysis and does not necessarily matches views of Bullion Exchanges and should not be considered as financial advice in any way.
Share:

