We are on alert for what is going to be a significant breakout of gold priced in Japanese yen terms. It could have an impact on gold as priced in the USD.
We are on alert for what is going to be a significant breakout of gold priced in Japanese yen terms. This will have significant ramifications not only for the precious metals but for diverse sections of the broader capital markets.
As a precious metals investor within the United States, you may wonder: “Why should I care about the price of gold in Japanese yen terms?” And to that, we answer: “Because it is going to have a tremendous impact on gold as priced in the US dollar this year.”
The pending breakout of gold in Japanese yen terms will send shockwaves through the financial markets. Not only do a host of traders place their bets for gold based on the Japanese yen, but entire “quant” (i.e. quantitative-based) hedge funds have built hundred-million dollar algorithms upon this indicator alone. The correlation is indeed this significant.
Yen and Gold Correlation
Let’s examine the history of the relationship:
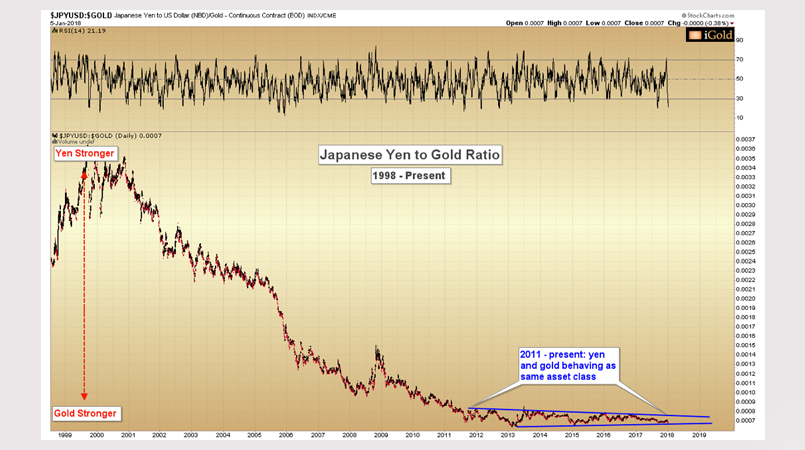
Gold and yen have moved nearly in unison for the better part of the last seven years. For proof, we need to look no further than the yen to gold ratio. This is the inverse of gold priced in yen, and it is useful to view in this manner because it allows us to observe the tightness of the correlation over the past seven years amidst what has been an overall declining trend on a longer-term basis:
Image A
Note above the blue callout (lower right), which shows how since 2011, the yen and gold have essentially behaved as the same asset class.
We believe this correlation is about to break.
Zooming-In on the Ratio
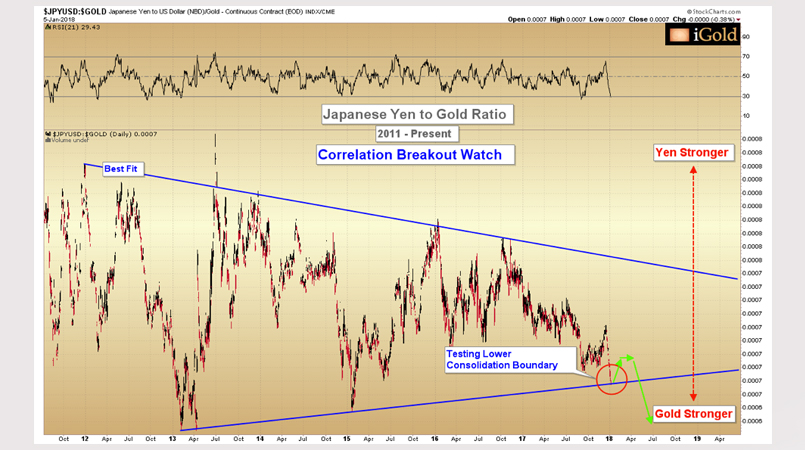
In order to see the process which is about to unfold with greater clarity, we must zoom in on the price action since 2011. Note that this is the exact same section shown above in blue:
Image B
Observe the recent plunge in the yen/gold ratio, highlighted by the red callout.
In technical analysis, a key tenet to consolidation evaluation is: “The longer the consolidation, the more significant the move to come.”
Here we see an extremely tight 7-year correlation between the Japanese yen and gold. With the drop seen in recent weeks, the ratio is now precisely testing the lower boundary (blue) of the 7-year pattern.
We do not expect that this strong correlation will give up without a fight. No correlation does. We expect a final bounce lasting up to 6 months, as indicated by the green arrows above, after which the yen as priced in gold should plunge.
The Coming Fall in Yen
The coming drop will see the yen lose significant value as priced in gold. But even more importantly, it will result in a sever of the multi-year correlation between the two asset classes which has allowed traders to consider them as nearly the same since 2011.
And when this relationship finally gives way, those traders will be forced to evaluate the two asset classes separately.
If the ratio breaks lower in favor of gold, vast quantities of investors and hedge funds will suddenly have to choose: yen or gold?
Most funds are momentum-based, and we believe they will choose to follow gold, not the sinking yen.
This breakdown is in play now. The smart money in Japan is positioning itself for the move to come by selling yen and buying gold. We can see this plainly on the charts.
Fundamental Drivers
What could fundamentally be behind this movement out of Japanese yen and into gold?
We see two primary drivers:
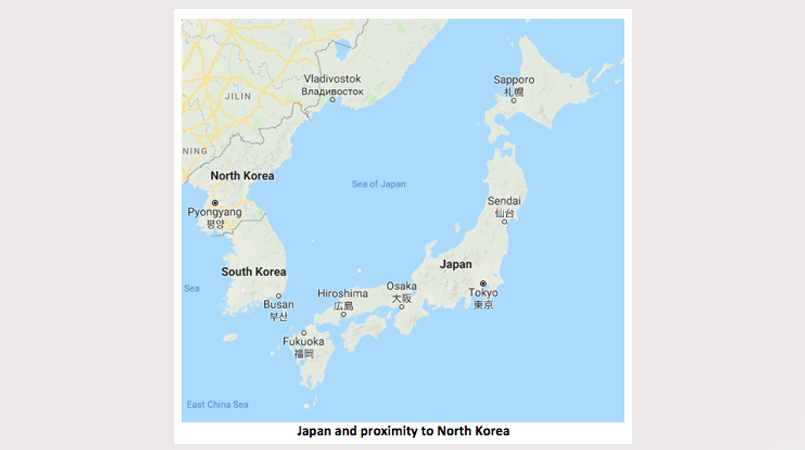
1.Increased tensions between North Korea and the United States, of which Japan is a major ally. We have seen in recent months Kim Jong-un fire missiles into the Sea of Japan, in close proximity to several of the islands. Are Japanese investors turning to gold for protection?
Image C
2.Decades of low and negative interest rates in Japan may be causing the yen to lose value. Recall that artificially-low interest policy requires continuous money-creation by the central bank in order to keep rates suppressed.
We cannot know the exact answer to why investors are now turning to gold over the Japanese yen because the gold market as priced in yen is composed of millions of distinct individuals, each acting for their own reasons. However, we can observe the reactions on the charts.
Takeaway on the Yen / Gold Relationship
Our charts show that the yen priced in gold is testing 7-year lows, momentum suggests that the decline seen in recent weeks is set to continue in 2018. A more significant plunge in yen/gold will be observed when we witness the multi-year correlation between the two asset classes sever for good. This is on the doorstep.
The breakdown in the yen/gold relationship will cause a bifurcation in the worldwide gold market. Investors who have been treating these two asset classes as the same will be forced to choose sides.
Which will they choose? A sinking yen, or a surging gold?
Christopher Aaron,
Bullion Exchanges Market Analyst
Christopher Aaron has been trading in the commodity and financial markets since the early 2000's. He began his career as an intelligence analyst for the Central Intelligence Agency, where he specialized in the creation and interpretation of pattern-of-life mapping in Afghanistan and Iraq.
Technical analysis shares many similarities with mapping: both are based on the observations of repeating and imbedded patterns in human nature.
His strategy of blending behavioral and technical analysis has helped him and his clients to identify both long-term market cycles and short-term opportunities for profit.
This article is provided as a third party analysis and does not necessarily matches views of Bullion Exchanges and should not be considered as financial advice in any way.
Share: