You can see that yen and gold have been highly correlated since 2011, moving closely in tandem during both corrections and surges nearly six years.
In Part 1 of this series last week, we examined the relationship between the Japanese yen and gold. We showed that both yen and gold have been highly correlated since 2011, moving closely in tandem during both corrections and surges since their respective peaks nearly six years ago.
As precious metals investors, what are we to make of this correlation? And how can we use the correlation to our advantage in the future?
Why Does the Correlation Exist?
First, let us address the “why” behind the yen/gold correlation.
The bottom line is that no one truly knows why the correlation exists because correlations between diverse asset classes never exist for solely one reason. Anyone who claims to have “the” answer in reality only has one of the said answers – because markets are made up millions of individuals, each acting on their own particular causes and assumptions.
That said, we can look to identify some contributing causes. Much of the correlation has to do with the perceived safety status of the Japanese yen. Although still a fiat currency, the yen in recent years has come to be known in the international trade as one of the safest currencies in the world, perhaps even more so than the US dollar.
Japan is notable for its low inflation relative to other developed world economies. Although the country has a large public debt, much of that debt is held domestically by investors. Japan also has a significant trade surplus, selling more to foreign trade partners than it imports. The yen-carry trade, a popular funding mechanism of the past decade in which investors borrow Japanese yen to buy assets in foreign countries, is a testament to the perceived stability of the Japanese economy and its ultra-low interest rates.
All of these reasons contribute to the safe-haven status of the yen, which in turn drives the correlation with gold.
Looking for Confirmation Signals
Although there is a myriad of reasons why the correlation is in place, for our purposes it will be more valuable to accept that it does indeed exist, and to next look for ways to utilize this information.
One of the more valuable forms of analysis we can thereby perform is to monitor for either confirmation or non-confirmation signals between the yen to dollar cross-pair (JPY/USD) and gold. These can help us gauge major turning points in the gold market.
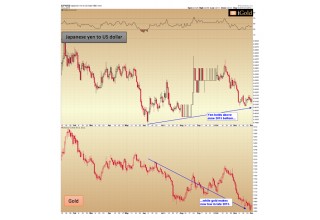
For example, in June 2015 gold began to make new lows under the $1,200/oz mark, eventually hitting $1,045 in December of that year. However, note that the Japanese yen failed to make a new similar low, instead of increasing marginally from 0.7950 to 0.8125 during this time:
Image A
Recall the main chart from last week’s article, showing the near perfect correlation over six years between the pair. Here in 2015 was a non-confirmation signal for gold’s final plunge in 2015. The yen and gold were, in fact, moving in opposite directions as a net sum over the final months of the decline.
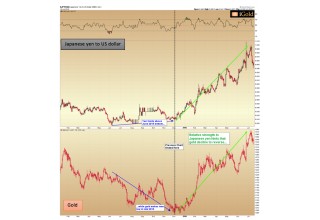
What did this non-confirmation in the yen signal for gold? We will let the charts speak for themselves, by extending out the above by another seven months:
Image B
It is clear that the non-confirmation signal in the yen in late 2015 was an excellent predictor of what is now seen as the final low for gold’s 2011 – 2015 bear market.
This is an important signal for those who are interested in gauging likely turning points in the gold market. Of course, no signal will be perfect 100% of the time. But we can push the odds of probability into our favor for the gold market if we pay attention to these confirmation or non-confirmation signals in the Japanese yen.
Watch for the Correlation to End
A final point on the topic for the time being: no correlation will last forever. There will come a time when – for fundamental reasons which will only be revealed after the fact – the tight correlation between the yen and gold will sever.
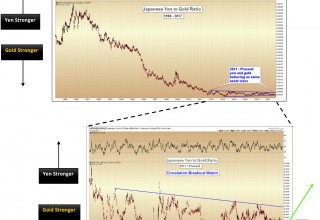
What more, the period of time following the breaking of this relationship will be important for precious metals investors to pay attention to, because it will signify either a rapid acceleration higher in the price of gold, or a severe plunge, depending on the direction in which the correlation breaks. To illustrate, refer to the following set of imbedded charts of the yen/gold ratio:
Image C
We will know the correlation is ending when the yen/gold ratio breaks either above or below the converging set of (blue) trendlines which have defined the relationship since 2011.
When zoomed in (bottom chart), due to the extension of the y-axis on this timescale, it appears that there is much variability which can still occur in the confines of this relationship. However, when we refer back to the original (top) chart, we can see that in the grand scheme of these two asset classes, the correlation is still very tight indeed. A breaking point could come at any time within the next 12-24 months.
If the convergence breaks higher (less likely) it will signify that the yen is set to gain value relative to gold. Conversely, if the ratio breaks lower (more likely) it will hint that after six years gold is finally ready to resume leadership amongst the safe-haven assets again, with a price rise in all currencies including the yen.
Christopher Aaron,
Bullion Exchanges Market Analyst
Christopher Aaron has been trading in the commodity and financial markets since the early 2000's. He began his career as an intelligence analyst for the Central Intelligence Agency, where he specialized in the creation and interpretation of pattern-of-life mapping in Afghanistan and Iraq.
Technical analysis shares many similarities with mapping: both are based on the observations of repeating and imbedded patterns in human nature.
His strategy of blending behavioral and technical analysis has helped him and his clients to identify both long-term market cycles and short-term opportunities for profit.
This article is provided as a third party analysis and does not necessarily matches views of Bullion Exchanges and should not be considered as financial advice in any way.
Share:

