The turning of the calendar gives us the opportunity to review gold price.
The turning of the calendar gives us the opportunity to review and reflect upon what has transpired over the course of the previous year amongst major world markets. Precious metals sit at a unique focal point spanning both millennia along with their modern role in financial stability amidst an increasingly uncertain world.
First, the raw numbers: gold finished higher for the second year in a row, rising by $157 or 14.7% to close at $1,309 as of the final tick on the New York futures market on the last trading day of the year. Silver underperformed on a relative basis in 2017 after outperforming a year prior, rising by $1.16 or just over 6% to finish at $17.15 in the futures market. Spot prices closed slightly lower in extended trading by late Friday afternoon.
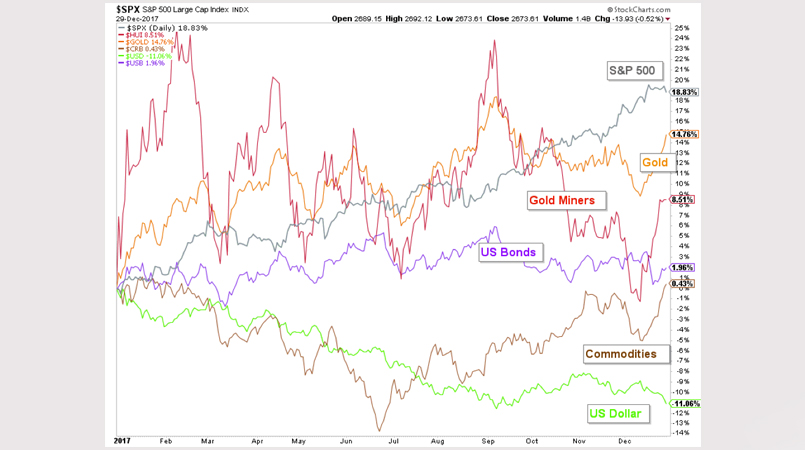
However, let us dig beneath the surface. How did gold compare with other major world asset classes over the past 12 months? Below, we show the relative performance of gold versus the most important assets that many precious metals investors monitor on a regular basis:
Image A
Points for consideration on the above:
- The US stock market, as represented by the S&P 500, edged just passed gold to finish higher by 18.8% for the year.
- Gold came in a close second at 14.7%.
- Gold miners failed to leverage the gains in gold this year, rising by just 8.5%. This is a prime example of why we always recommend a physical gold position even for those looking for leverage to the metals – the mining sector will have distinct periods of underperformance for certain years.
- US long-term bonds edged higher by just under 2.0%.
- Broad commodities represented by the CRB index, an average of 19 of the world’s most actively-traded commodities, were mostly flat for the year.
- Most notably, the US dollar was sharply lower, falling by over 11%.
Safety Assets
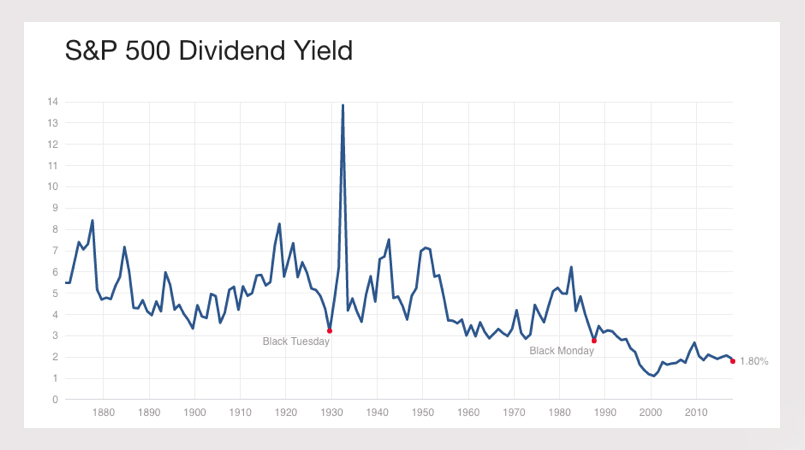
We view world stock markets to be overvalued on a fundamental basis. For example, examine the history of dividend yields for the largest 500 companies in the US dating back to the late 1800’s. Dividend yields move opposite to stock prices, and what we observe below is that current yields are much closer to previous stock market peak levels than to value buy zones:
Image B
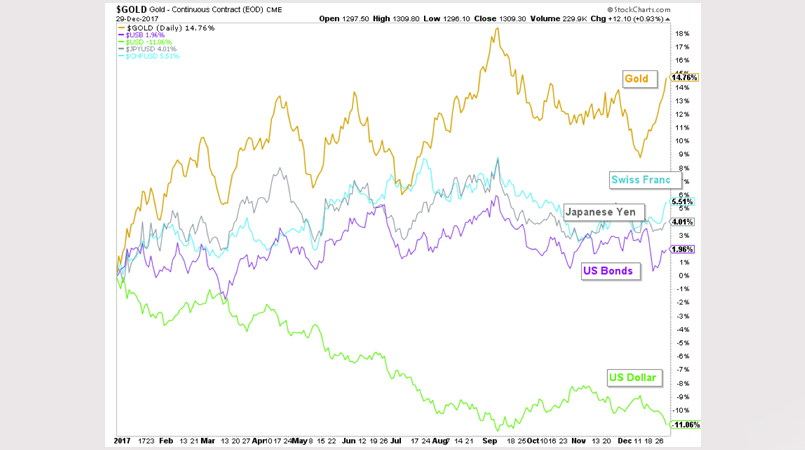
Let us view the following five assets which have traditionally been purchased by investors when they are seeking safety from declines in stock markets.
- Gold – the 5,000-year store of wealth.
- Swiss Franc – was legally mandated by the Swiss government to be backed by at least 40% gold until the year 2000. Still, to this day, the Swiss National Bank is seen to be more fiscally conservative than most western central banks. The Swiss Franc thus retains a safe-haven status to this day.
- The Japanese Yen – the Yen has moved largely in tandem with gold prices since 2007. This high correlation has resulted in investors viewing the Yen as a safe-haven currency in times of volatility.
- The US Dollar – to this day, still the closest to a world reserve currency that is commonly recognized across the planet.
- US 30-year bonds – traditionally seen as the most conservative long-term investment amongst those looking to guarantee a specific interest payment over many years.
As we will see, gold outperformed all other safety assets during 2017.
Safety Assets Change
It is important for investors to know that the definition of a safety asset will change throughout time. For example, in the subprime / US credit crisis of 2008, as most international markets collapsed, gold actually fell during the initial crash as the US dollar rose.
Yet during the collapse of the dot-com bubble in the year 2000, as the stock market fell, so did the US dollar. What rose in opposition? Gold.
The point is: safety assets do change throughout time. On this point, we have covered the potential for a breakdown in the strong correlation between gold and yen prices in a recent article.
Moreover, we have shown that the US dollar is forming an important long-term top on the charts ( "US Dollar approaching critical support").
Meanwhile, large institutions such as Ray Dalio of Bridgewater Associates, have notably increased their holdings of gold in 2017 (Gold - a tale of two markets).
2017 Summary
In sum, through 2017 we see a confirmation that gold is attempting to regain its status as the safest asset of last resort amongst large investors. Both headlines and gold’s price performance this year prove this point.
All signs point to the emergence of a new rising trend in gold prices, although we anticipate regular corrective declines along the way.
The new year will be filled with twists and turns – but we will be here to provide the clearest analysis possible as these trends continue to unfold.
A healthy and prosperous 2018 to you.
Christopher Aaron,
Bullion Exchanges Market Analyst
Christopher Aaron has been trading in the commodity and financial markets since the early 2000's. He began his career as an intelligence analyst for the Central Intelligence Agency, where he specialized in the creation and interpretation of pattern-of-life mapping in Afghanistan and Iraq.
Technical analysis shares many similarities with mapping: both are based on the observations of repeating and imbedded patterns in human nature.
Share: